Climate Science Glossary

Term Lookup

Enter a term in the search box to find its definition.

Settings

Use the controls in the far right panel to increase or decrease the number of terms automatically displayed (or to completely turn that feature off).

Term Lookup

Settings


All IPCC definitions taken from Climate Change 2007: The Physical Science Basis. Working Group I Contribution to the Fourth Assessment Report of the Intergovernmental Panel on Climate Change, Annex I, Glossary, pp. 941-954. Cambridge University Press.

Home Arguments Software Resources Comments The Consensus Project Translations About Support

Bluesky Facebook LinkedIn Mastodon MeWe

Twitter YouTube RSS Posts RSS Comments Email Subscribe


Climate's changed before
It's the sun
It's not bad
There is no consensus
It's cooling
Models are unreliable
Temp record is unreliable
Animals and plants can adapt
It hasn't warmed since 1998
Antarctica is gaining ice
View All Arguments...


Username
Password
New? Register here
Forgot your password?

Latest Posts

Archives

Sea level rise: coming to a place near you

Posted on 18 March 2011 by Daniel Bailey

It has been said that our coastal cities are but castles made of sand.  And like sand, they will fall into the sea, eventually.  No one can tell the day or the hour, but with the expected rise of sea levels from the warming of the world and the measured melt of its polar regions, we know that it will happen.

Projections

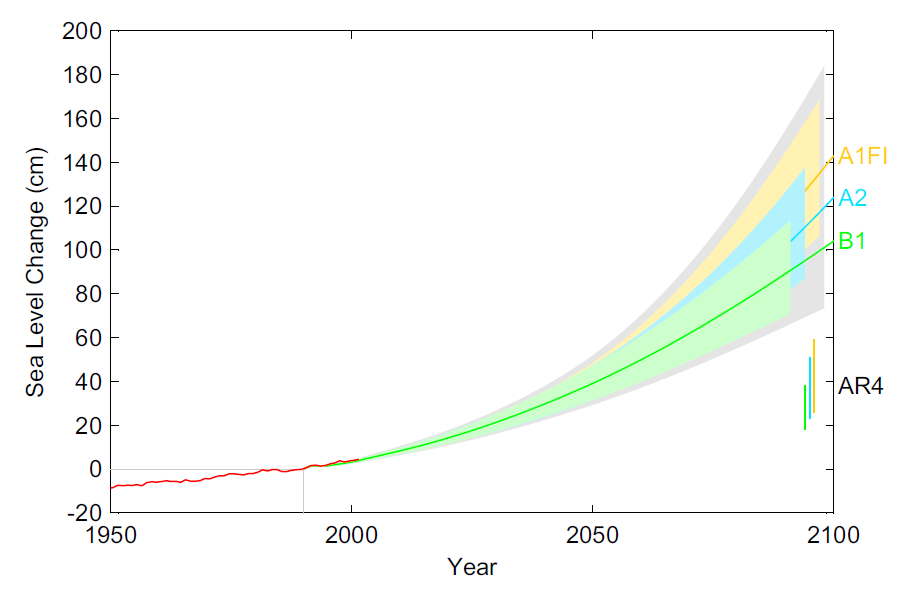
Figure 1 (Vermeer & Rahmstorf 2009).  Current projections call for 1 or more meters of sea level rise by 2100

Currently we're on track to reach 1 meter sometime between 2070 and 2090 in business as usual (the A scenarios), and even most likely by 2100 in Scenario B1 (which assumes a major move away from fossil fuels toward alternative and renewable energy as the century progresses).

A wise man once asked: 

"How many roads must a man walk down before you call him a man? 
How many years must a mountain exist before it's washed to the sea?   
How many times can a man turn his head pretending he just doesn't see? 
How many deaths will it take till he knows too many people have died? 
The answer my friend is blowin' in the wind..."

The effects of sea level rise, like the meaning of the song above, is different to each of us.  So what will sea level rise look like where you live, when it does come?  Using the map visualization tools provided from the Department of Geosciences at the University of Arizona, we can figure that out.  Let's take a look, shall we?

America the Soggy

Portions of the United States stand to be hard-hit by sea level rise.  None will be more impacted than New Orleans, Louisiana and Miami, Florida.  Note that the areas in red delineate those inundated by the first meter of sea level rise, those in tan (sorry, didn't pick the colors) by an additional 5-meter rise in sea levels above and beyond the first meter of rise (for a total of 6 meters of rise).
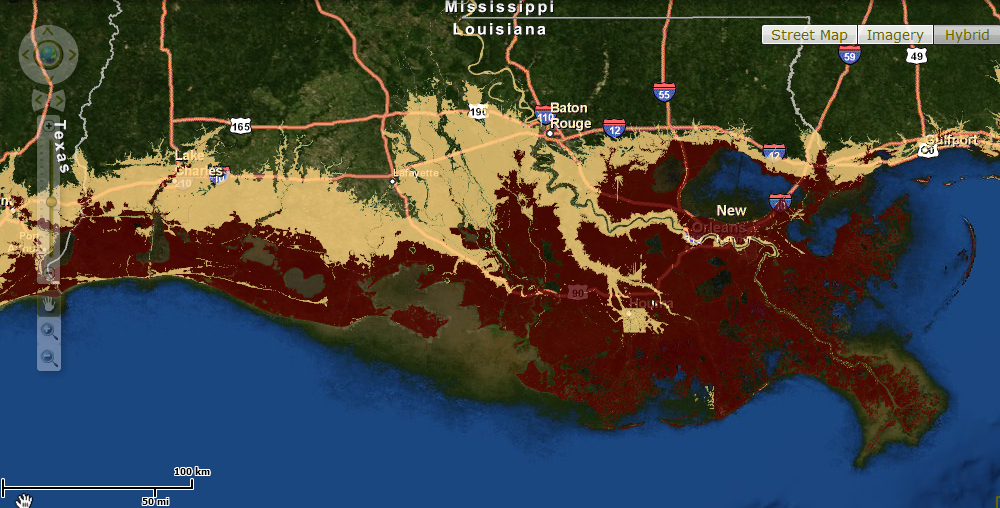
Big Easy

Map 1.  New Orleans This time, the story's over.
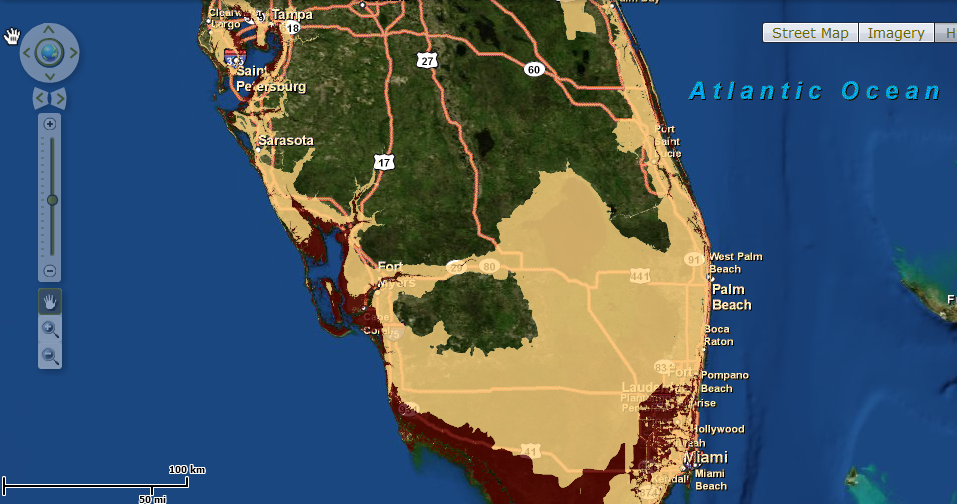
Miami

Map 2.  Miami and south Florida.  Our memories of South Beach will only come from reruns of Miami Vice.

Moving up the Atlantic coast, other impacted areas include:  Savannah - Charleston, Cape Hatteras, Washington DC (see below for the close-up of the Nation's Capital), Baltimore, Philadelphia, New York City and Boston.
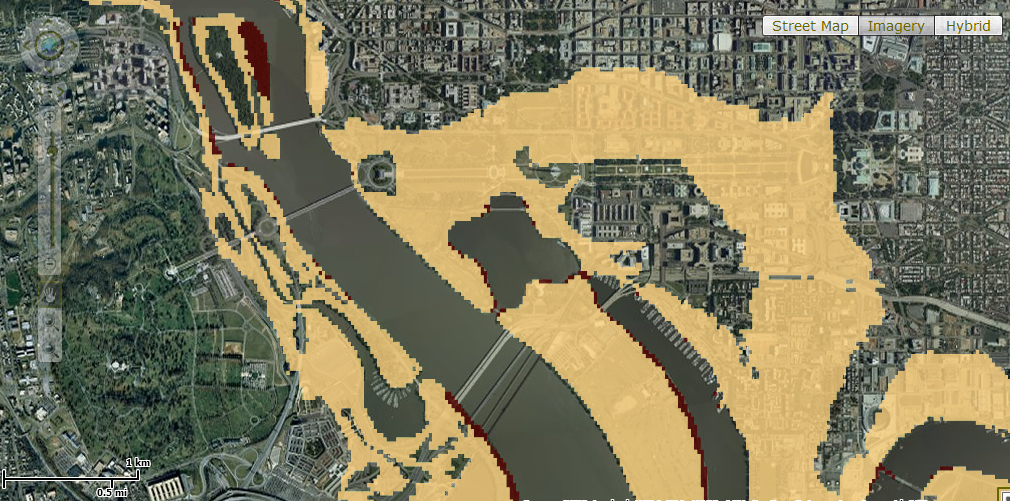
DC

Map 3.  Washington DC (closeup).  Yes, we did (it).

A look at the rest of the US: San Diego, San Francisco, Honolulu, and Prudhoe Bay of Alaska

Water World
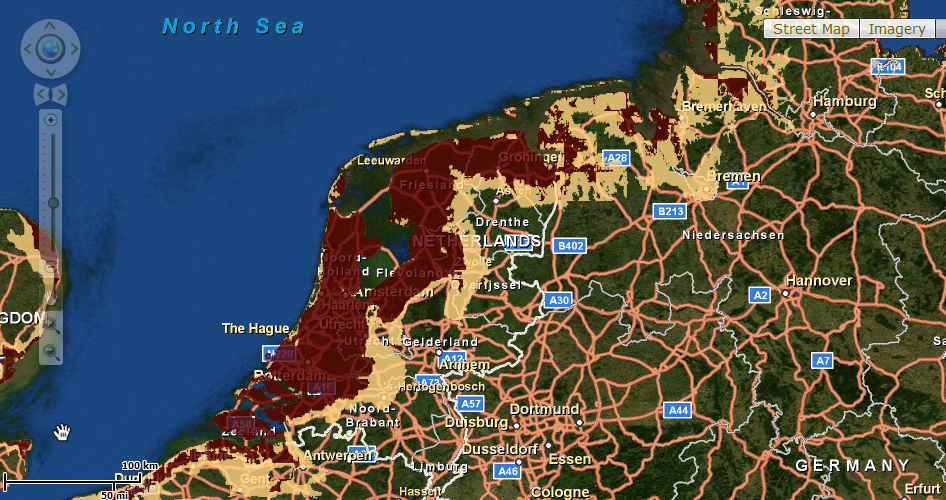
Netherlands

Map 4.  One meter of sea level rise wipes out the International Court at The Hague; 6 meters, most of the Netherlands.

Australia:  Brisbane, Sydney

Bangladesh

Brazil: Rio de Janeiro

China: Beijing, Shanghai

Denmark:  Copenhagen

Egypt:  Cairo

England:  Liverpool, London

Ireland:  Dublin

Italy:  Pisa, Venice, downtown Venice

Japan: Tokyo, downtown Tokyo

Maldives

Netherlands

New Zealand:  Christchurch

Orinoco River Delta

Singapore

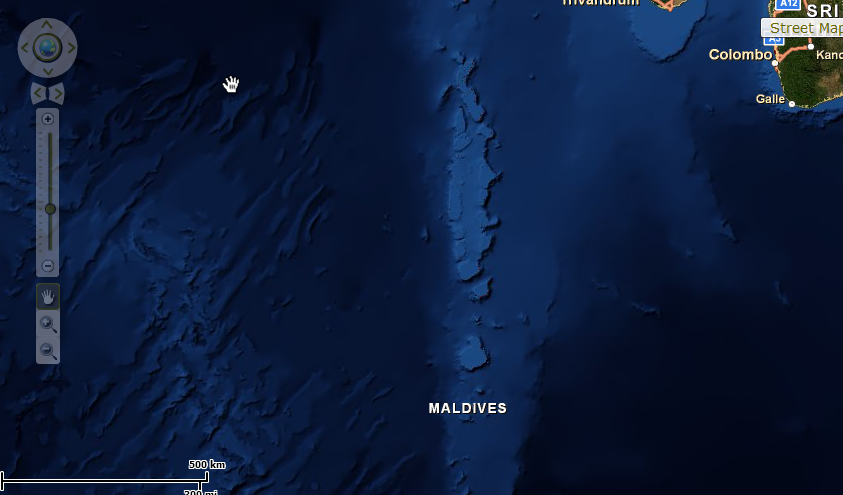
Maldives

Map 5.  The poster child for sea level rise, the Maldives was once a vast island during the last glacial maximum, when sea levels were at their lowest ebb.  Reduced now to but a string of island dots on a map, the Maldives will soon cease to be anything but a distant memory for our descendants.  And a lasting testament to the willful folly of mankind.

We live now, in the present.  Here in the present, sea level rise of the magnitudes portrayed above have yet to come to pass.  But they will, eventually.  Perhaps not in our lives but in that of those that yet live, or have yet to be.  But come, it will.

And how many nations will cease to be before mankind acts?  How many cities inundated?  How many lives lost?  The answer, my friends, is blowin' in the wind...

0 0

Printable Version  |  Link to this page

Comments

Comments 1 to 24:

  1. Articles like this could be separated into a general information on Climate Change section that the general public would, if directed there, go to in preference to a lot of the other articles on this site, which are often esoteric in nature and beyond a lot of us, me included. This article would do wonders for public involvement in the issue if they were to become worried that the value of their property was going to suffer. Let's face it, property prices are going to tumble long before the waves are licking at the front door. To paraphrase the wise man quote abov: The Tides, They Are A Changin'.
    0 0
  2. Oi! You've listed Christchurch in NZ as liable for flooding with a rise in sea level. Don't forget a good chunk of Auckland, Tauranga, Napier, Wellington, Nelson, Greymouth, Dunedin and Invercargill. About the only main center that will escape it will be Hamilton. And Lawrence.
    0 0
    Moderator Response: [DB] Christchurch was chosen as it had recently been in the news due to the earthquake there. All coastal cities in NZ (as you note) and throughout the world will have to deal with sea level rise at some point.
  3. This is all very interesting, but I have a problem with justifying the comment "currently we're on track to reach 1m." As I live in Sydney, and Sydney is mentioned, I checked the Fort Denison data, which shows no sea level rise over the past few years, and about 8mm over the past 25 years. 1998 was the hottest year over the past 160 years, and this year so far has seen a temperature drop. Now, I may well accept that sea levels will rise, but I can't say we're "on track" to reach 1m increase by 2090. We need to see some temperature increase, and/or sea level increase.
    0 0
  4. The situation for the Netherlands doesn't seem fair or realistic in this comparison. Half of the country is already below sea level and man-made that way, surrounded by dikes and (wind)mills, completed with an enormous irrigation network to constantly pump the water out and to protect it against storms from the North Sea or floodings from meltwater out of the Rhine. If the map would have a setting for nil change, it would still show half the country flooded (like the less than 1 meter change now), which just isn't the case (I'm typing this from 4 meter below sea level as we speak and I'm still dry). A storm (usually combined with moon setting) in 2006 caused an almost 5 meter sea level rise above the average level in Holland, but the dikes still held (in contrast to 1953 which killed 1863 people, causing a huge delta plan with new dikes and barriers to prevent that form ever happening). The whole system is constantly maintained, monitored, fortified and updated, in contrast to poor countries with low lying areas. I'm not saying sea level rise won't be a problem, but for Holland the consequences won't be like portrayed in the map.
    0 0
  5. piloot - I tried to check sea level change in your area. If the Scandanavian countries nearby are any indication, you have little to worry about. Sea levels have dropped about 250mm over the past 130 years. It looks like there are other bigger influences than climate change out there.
    0 0
    Moderator Response:

    [DB] Rates of isostatic rebound experienced thus far will be dwarfed by the rates of SLR to get to the 1 meter SLR expected by 2100 (1,000mm over 90 years). Unless Hansen is right about the nonlinearity of ice sheet loss to come, in which case that rate jumps to 5,000mm over 90 years.

    The current mapping tool does not reflect impacts from isostatic rebound; some future iteration will (it is being looked at).

  6. rhjames @5 I'm guessing that Scandanavia, like Scotland, is experiencing rebound after the last Glaciation. The potentially bad news for piloot is that the extent of Glaciation in the UK means that the lower half is sinking due to the same effect. The same could be true of the Netherlands, since it lies at a similar latitude.
    0 0
  7. piloot. OK add 5m to sea levels then add the storm which would add another 5m. The point being is that you have to think in terms of mean or average increases, then add your highest yearly tides, storms etc. The result is that flooding occurs more frequently.
    0 0
  8. Blowing up the sea level projection:

    it looks like there should be close to 5 cm/decade, but we are only measuring 3 cm/decade.
    0 0
    Moderator Response: (DB) This thread is about visualizing the impacts of sea level rise; debating actual SLR vs projections is discussed on other threads and is off-topic here. Thanks!
  9. ok thanks, I will read through the other threads. Minor note on browsing (please delete this comment): the images of the impacts are stored at 900-1000 pixels wide and downloaded in that resolution then scaled by my browser to 500 pixels. The download was a bit slow on my connection so if they could be stored around 500 pixels wide that would reduce download time by about 4x
    0 0
    Moderator Response:

    [DB] Sorry for that, Eric. I had to compromise with what to show or not show for the exact same reason. When I created the original files, I used cartographic license to decide the optimal scales to visually depict each area affected by SLR. Too small a resolution would have compromised many a picture.

    Anyone can use the linked mapping program to look at any location in the world themselves (for those feeling left out because I didn't choose their city). It's actually pretty simple to use.

  10. Thanks for the article, Daniel. I hadn't seen that particular site before when searching for sea level rise mapping. For folks in Australia, I highly recommend the OzCoasts mapping found here. It's based on much higher-resolution elevation data than the Uni of Arizona mapping, so gives a more accurate picture for the selected areas of Australia that have been mapped. Having said that, they only look at up to 1.1m of sea level rise, as their "high level" SLR. Their interface kinda sucks, too, for people used to Google Maps style pan & zoom interfaces! I think the mapping at this site is not bad, also. It lets you look at SLR up to +60m (the *real* worst-case scenario, though it'd most likely be centuries away)
    0 0
  11. Sh*t, the whole of Singapore's going to be swamped. And THAT's where I live.
    0 0
  12. "Currently we're on track to reach 1 meter sometime between 2070 and 2090 in business as usual (the A scenarios), and even most likely by 2100 in Scenario B1 (which assumes a major move away from fossil fuels toward alternative and renewable energy as the century progresses)." could you be more precise about what you mean by "being on the track?" with an exponential extrapolation with uncertainty, it seems that we're "on the track" to reach anything between 30 cm and a few meters. Please note a convenient feature of exponential extrapolations : any increase of uncertainty increases more the high values than the small ones, so increases both the average estimates and the "probability" of highest estimates. This has the logical consequence that the less we know, the more we're urged to act.
    0 0
    Moderator Response: [DB] One of the logical consequences of reading a Skeptical Science post and the previous comments on the posted thread is to realize that the focus of this thread is on SLR impacts. Discussion of SLR uncertainties & the "pacing" of SLR is best conducted on one of the many other threads. Please use the Search function to find one of those other threads where, no doubt, an answer to your questions exists. Thanks!
  13. ( -Snip- )
    0 0
    Moderator Response: [DB] Adherence to the Comments Policy is not optional. You were previously told of the specific nature of this thread, that your comment focus was off-topic here and that other threads exist more suited to your comment focus & to place those questions there. Participation in comment threads at Skeptical Science is a privilege, not a right to do as one pleases. Thanks for helping keep our community streets tidy!
  14. Thanks for the interesting post Dan, these sorts of interactive tools are really useful. That said, it looks like care is needed when applying it outside the USA where it has a "horizontal resolution of 1 km" compared to a much more accurate "30m" with the US. 1km is probably fine for large low lying areas but not much good for coastal cities based around low hills (Brisbane, Australia is a good example). Comparison the Brisbane prediction to data from much higher resolution maps from the Oz govt linked to by Bern (comment 10), shows good agreement for some areas; i.e.: with 1.1m SLR and a high tide Brisbane airport will either need a sea wall or sea planes. But low agreement in other areas; i.e.: some coastal suburbs suggested to be mostly underwater, will be still above water, though not unscathed by 1.1m SLR. So yes a useful tool but requires care outside the US.
    0 0
    Moderator Response: [DB] Agreed. Brisbane was included as it was both topical (Queensland flooding) and where our SkS founder (John) lives. Mapped impacts also do not reflect ongoing adaptation efforts, such as in the Netherlands.
  15. Thanks for the reply Dan. No doubt a number of countries have produced high resolution maps of land that could be lost to sea level rise. Perhaps links to some of these would be a good addition to the excellent resources on this site, as well as being useful for those of us outside the USA.
    0 0
  16. (Re: K T #11) It seems to me that the potential inundation map of Singapore is factually wrong. The terrain is really low, but it is unlikely that more than half of area is less than 1 m above sea level. I have not examined appropriate reference books yet, but by a quick Google search, I find an academic geographic paper by R.D. Hill (1980) Singapore - An Asian City State. Though subscription is needed to read the whole text, I can read its first page which contains "Tab 1. Singapore Island: Areas of various elevations (%)" with "Source: Wong 1969", and the percentage of "0 - 15 m" is 63.7. So, 36.3 % of the area has elevation higher than 15 m. It seems that the national data of Singapore were mis-interpreted, probably during the editing of the global elevation data set, before the global data set was incorporated in the analysis by the Univ. Arizona team.
    0 0
  17. I wold like to see Lima, the capital of Peru, in the list. Where I live is safe (100 meters above sea level) but other areas of the city are not so lucky. I would like to see where and how extensive those areas are.
    0 0
    Moderator Response: [DB] Unless you live in the vicinity of Callao, at no other point does the tool show even a 6-meter rise penetrating more than 2 pixels (2 kilometers) inland (to perhaps La Merina Ave/St/Rd). Wikimapia (the linked viewer) uses a much denser dataset than the mapping visualization tool.
  18. While I believe sea level rise will exceed 1 metre by the end of the century, I need to point out that your map showing projected inundation of Sydney is wrong. I should know. I live there! While there are some low lying areas of alluvial fill south of Sydney Harbour, the red shaded area should be a fraction of that shown on this map.
    0 0
    Moderator Response: [DB] Thanks for pointing that out, Alan! Dr. Weiss has indicated that future iterations of the mapping tool will have a number of improvements including superior resolution. Let's hope they are able to obtain more robust datasets from Australia!
  19. Alan (comment 18). The issue is that outside the USA the tool has a "horizontal resolution of 1 km" which might work ok for somewhere like Melbourne, but not Sydney or Brisbane (to keep it local). See here for some higher resolution info on the effect of SLR on Sydney. It only goes up to 1.1m so gives some indication of what will likely happen this century.
    0 0
  20. The map of Sydney is certainly wrong - a lot of the eastern suburbs are on 50 meter cliffs overlooking the sea, for example. Even on the shores of Port Jackson (Sydney Harbour) there are typically steep gradients to the water line. On the map linked at 19, click on "Edgecliff - Bondi" for example.
    0 0
  21. In the article caption for Map 5 is "Map 5. The poster child for sea level rise, the Maldives was once a vast island during the last glacial maximum, when sea levels were at their lowest ebb. Reduced now to but a string of island dots on a map, the Maldives will soon cease to be anything but a distant memory for our descendants. And a lasting testament to the willful folly of mankind." I wonder how many are aware that that the Maldives on on a limestone platform of over 2000 meters thickness. The volcanic substrate upon which the island chain rests is 2000+ meters below the surface, yet the islands remain. How does that happen? Darwin figured it out in 1837. His hypothesis was that coral atolls were large coral/limestone formations on top of submerged volcanic rock. In 1896-1896 the Royal Society of London drilled on that other post child of CAGW activists, Tuvulu. They got down to more than 1100'/340 meters and were still in limestone created by corals. Corals don't grow very fast if submerged more than a few 10's of meters. The existence of coral atolls through the many past changes in sea level are a testament to the resiliency of the coral atoll systems.
    0 0
  22. Charlie A -"Corals don't grow very fast if submerged more than a few 10's of meters. The existence of coral atolls through the many past changes in sea level are a testament to the resiliency of the coral atoll systems." It's very likely Dan Bailey is correct and the Maldives will be submerged in the future. Like Pacific atolls, the Maldives were subjected to higher than present sea levels earlier in the Holocene. See Kench 2008. Accordingly these atolls too will have solid reef flats that formed during this period of higher sea level. These serve to protect them from long-term sediment loss. However once the reef flats are submerged by the rising high tide, the coral rubble, sediment and thin soils which have accumulated, will be subject to wave damage. Add ocean acidification & coral bleaching into the mix and the future looks a bit dicey. It's a fallacy that atolls, as they now appear, have existed for a long time. They only began forming once the rising sea level, coming out of the last glacial maximum, submerged the atoll summits which formed during the previous interglacial. Something Darwin was unaware of when he first proposed his reef formation hypothesis.
    0 0
  23. That wasn't a wise man, it was Bob Dylan!
    0 0
  24. The mighty Tamino strikes again, with an excellent debunk of a new paper that touts no acceleration in sea level rise. An eye-grabber is this figure: According to this, the recent rate of sea level rise is greater than its average value since 1930. Significantly so (in the statistical sense), even using a conservative estimate of autocorrelation. But the increase itself hasn’t been steady, so the sea level curve hasn’t followed a parabola, most of the increase has been since about 1980. Once again, a long term uptrend, with a noticeable change in the late 70's-early 80's. The rate of increase increases. Kind of a deja vu all over again.
    0 0

You need to be logged in to post a comment. Login via the left margin or if you're new, register here.


The Consensus Project Website

THE ESCALATOR

(free to republish)


© Copyright 2024 John Cook
Home | Translations | About Us | Privacy | Contact Us