Climate Science Glossary

Term Lookup

Enter a term in the search box to find its definition.

Settings

Use the controls in the far right panel to increase or decrease the number of terms automatically displayed (or to completely turn that feature off).

Term Lookup

Settings


All IPCC definitions taken from Climate Change 2007: The Physical Science Basis. Working Group I Contribution to the Fourth Assessment Report of the Intergovernmental Panel on Climate Change, Annex I, Glossary, pp. 941-954. Cambridge University Press.

Home Arguments Software Resources Comments The Consensus Project Translations About Support

Bluesky Facebook LinkedIn Mastodon MeWe

Twitter YouTube RSS Posts RSS Comments Email Subscribe


Climate's changed before
It's the sun
It's not bad
There is no consensus
It's cooling
Models are unreliable
Temp record is unreliable
Animals and plants can adapt
It hasn't warmed since 1998
Antarctica is gaining ice
View All Arguments...


Username
Password
New? Register here
Forgot your password?

Latest Posts

Archives

Monckton Myth #13: The Magical IPCC

Posted on 17 February 2011 by dana1981

Monckton Myths (200 x 70 pixels)And now, for its next trick, the IPCC will make the Medieval Warm Period disappear!

As a new addition to the Monckton Myths, this post examines a claim commonly made by Christopher Monckton that the Intergovernmental Panel on Climate Change (IPCC) "ingeniously wiped out" and "artificially eradicated" the Medieval Warm Period (MWP).  "Skeptic" blog WattsUpWithThat has similarly claimed that the IPCC "disappeared" the MWP.

Origins of the Myth

Monckton makes this claim ("now you see it, now you don't") in his Apocalypse? No! article.  As shown on page 42 of this article, the myth seems to be based on Figure 7.1c from the IPCC First Assessment Report (FAR):
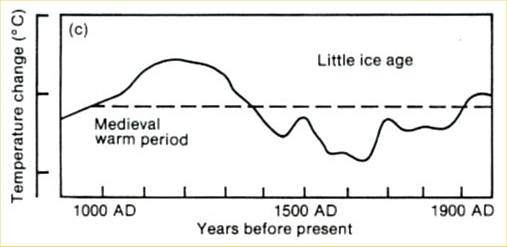
Figure 1:  IPCC FAR Figure 7.1c - Schematic diagram of global temperature variations for the last thousand years. The dotted line represents conditions near the beginning of the twentieth century.

As you can see, IPCC FAR Figure 7.1c appears to show the MWP quite prominently, with a peak warmer than the temperature as the end of the graph.  But it's a rather strange figure - the temperature axis doesn't even have any numbers, and it looks hand-drawn.  Where did it come from? 

Pulling a Lamb out of a Hat

Jones et al. (2009) explore the origins of this figure.  They note that the figure caption specifically stated that it was a schematic diagram, and not an actual temperature reconstruction. 

"as far as palaeoclimatologists were concerned the diagram was nothing more than how it was originally described in the caption: a schematic."

Jones et al. trace the schematic diagram back to a series used by H.H. Lamb, representative of central England, last published by Lamb (1982).  However, Lamb is plotting 50-year averages here, and the final data point appears to be 1950.  Jones et al. superimpose IPCC FAR Figure 7.1c (black) with Lamb's central England temperature (red) and add the Central England Temperature data up to 2007 (blue):
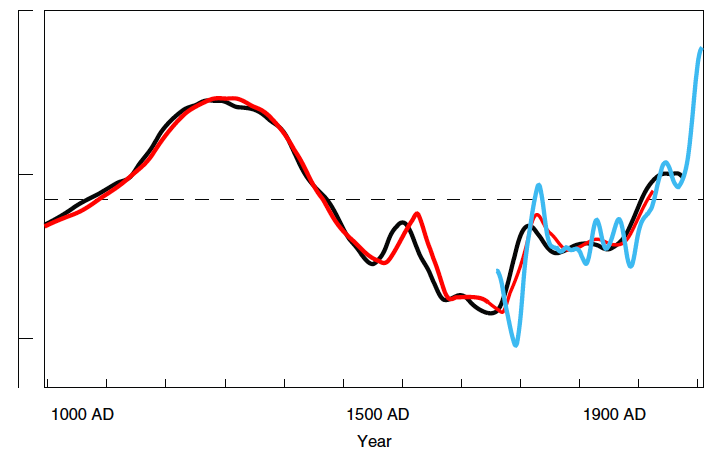
 

Figure 2:  The black curve and the x- and y-axes are a redrawn version of IPCC FAR Figure 7.1c.  The red curve is from Lamb (1982). The amplitude of this curve has been scaled to correspond to that of the black curve. The Lamb (1982) time series does have an explicit temperature scale, and the best-fit scaling between this curve and the IPCC curve indicates that one tick-mark interval on the IPCC figure corresponds almost exactly with 1°C.  The blue curve is a smoothed version of the annual instrumental Central England Temperature record from Manley (1974, updated) including the last complete year of 2007. This has been smoothed with a 50-yr Gaussian weighted filter with padding.

Central England temperatures have risen by over 1°C since Lamb's last measurement.  Jones et al. also note about Lamb's schematic:

"At no place in any of the Lamb publications is there any discussion of an explicit calibration against instrumental data, just Lamb’s qualitative judgement and interpretation of what he refers to as the ‘evidence’....Greater amounts of documentary data (than available to Lamb in the early 1970s) were collected and used in the Climatic Research Unit in the 1980s. These studies suggest that the sources used and the techniques employed by Lamb were not very robust (see, eg, Ogilvie and Farmer, 1997)."

In short, Figure 7.1c from the IPCC FAR was based on Lamb's approximation of the central England temperature.  It was intended only as a schematic diagram, and known not to accurately reflect the global average temperature. 

Advancements in Science

The Lamb diagram was dropped from the Supplementary IPCC report in 1992.  Subsequent IPCC reports showed the first northern hemisphere temperature reconstructions based on proxy data.  The IPCC Second Assessment Report (SAR) examined Bradley and Jones (1993).  The IPCC Third Assessment Report (TAR) examined Jones et al. (1998); Briffa (2000)Crowley and Lowery (2000); and of course Mann, Bradley, and Hughes (1998) and (1999) (the so-called "hockey stick").

The IPCC TAR featured the "hockey stick" fairly prominently.  The rather widespread belief that "the hockey stick is broken" and "suppressed" the MWP may contribute to this myth that the IPCC "disappeared" the MWP.  However, although the MWP was not shown as prominently in the "hockey stick" as most other reconstructions due to the statistical methods employed in the study, all subsequent northern hemisphere temperature reconstructions have confirmed the general "hockey stick" shape. 

Figure 3: Various northern hemisphere temperature reconstructions using climate proxy records (Source: NOAA NCDC)

Furthermore, all of these reconstructions demonstrate that the present average northern hemisphere temperature is likely hotter than at the peak of the MWP.  It's important to note that northern hemisphere temperature reconstructions are obviously much more representative of global temperatures than the temperature in central England.  And it's also worth noting that most of the warming during the MWP was geographically located at high latitudes in the northern hemisphere.

Magicians without Secrets

On top of all this, the IPCC is very careful to discuss exactly what we know about MWP temperatures.  Here is an excerpt from  the IPCC Fourth Assessment Report (WG1 Chapter 6 page 468):

"The evidence currently available indicates that NH mean  temperatures during medieval times (950–1100) were indeed warm in a 2-kyr context and even warmer in relation to the less sparse but still limited evidence of widespread average cool conditions in the 17th century (Osborn and Briffa, 2006). However, the evidence is not sufficient to support a conclusion that hemispheric mean temperatures were as warm, or the extent of warm regions as expansive, as those in the 20th century as a whole, during any period in medieval times (Jones et al., 2001; Bradley et al., 2003a,b; Osborn and Brif a, 2006)."

The bottom line is that the IPCC did not "disappear" the MWP.  Rather, the IPCC has done its job correctly by evaluating the best available data and scientific studies at the time of each report.  As climate scientists obtained more temperature data, it became clearer and clearer that the MWP was not hotter than present temperatures.

Memo to Christopher Monckton: a schematic of central England temperatures to 1950 is not quite the same as a reconstruction of northern hemisphere temperatures to 2007!  The IPCC has done some impressive work, but it's no Harry Houdini.

Monckon vs. Monckton

Monckton's favorite argument is "climate sensitivity is low".   But if the MWP was particularly hot, that means there was a fairly large temperature change about 1,000 years ago.  The hotter the peak of the MWP, the larger the temperature change, and the more sensitive the climate was to the factors causing that change (mainly increased solar activity and decreased volcanic activity).  Arguing for a hot MWP is arguing for a high climate sensitivity to these natural factors, and if the climate is sensitive to an energy imbalance caused by a change in solar or volcanic activity, there's no reason it wouldn't also be sensitive to changes in greenhouse gases as well.

In short, a hot MWP also means a high climate sensitivity.  By arguing for a hot MWP, Monckton is contradicting his own favorite argument.

NOTE: This post (written by Dana Nuccitelli [dana1981]) is also the Intermediate rebuttal to "IPCC 'disappeared the MWP".

0 0

Printable Version  |  Link to this page

Comments

Comments 1 to 33:

  1. Dana, The MM logo is obscuring some of the text. Good post by the way.
    0 0
  2. The text isn't obscured but it does look a little wonky. I'll try to fix it, thanks.
    0 0
  3. Oh right, sorry Dana..I guess "looks wonky" is what I should have said.
    0 0
  4. Dana, I originally discovered this site after a skeptic/denier acquaintance of mine unleashed a flood of accusations in the wake of Climategate. I decided I needed to reexamine my what I thought I knew about AGW. Most of what I could find was just rehashing the Climategate accusations of fraud and conspiracy. It was not until I discovered RealCliamte and SkS that I found any actual substance. Informative and easy to understand posts like this one are what keep me coming back. Thank you and and everyone else who contributes here.
    0 0
  5. Thanks pbjamm!
    0 0
  6. I once came across a weird statement of Mockton that the Viking graces at Hvasley church in Greenland are now embedded in permafrost. That is totally untrue... Hvalsey is actually sinking into soft clay. Hvalsey Church
    0 0
  7. Woops ... for "graces" read "graves"
    0 0
  8. Just as an addendum, it always seemed to me that this guff about the Medieval Warm Period could be easily killed off by consideration of the archaeological and historical evidence of the period. Being form Ireland, I take an Ireland-centric view. For example, I can across the work of a Welsh clergyman Giraldus Cambrensis who visited Ireland about 1185, when Ireland (supposedly) had a climate something like Portugal has now. Geraldus gave a complete description of the country and climate, and what he described reads a lot more like 20th century Ireland than Portugal!! He describes the wet, temperate conditions fairly accurately. Because of the Gulf Stream, some microclimates on our west coast share plants with Portugal and even the Canary Island. So it is not as if exotic plants had no time to get here. Similarly, some deniers have described the fields of wheat, oats and barley the Vikings grew in Greenland. However, the Norse were pastoral farmers. They had small gardens but herds of cattle and sheep were their pride and joy, and hay as a winter feed their most important crop. So you do not need a temperature record to dispove their extravagant claims about the Medieval Warm Period.
    0 0
  9. I have to admit, it took me a couple of careful reads to absorb this article. So, just to make sure that I'm clear on this: 1. The MWP was an event localized to the more northerly latitudes of the Northern Hemisphere. 2. The MWP was above average globally for that period, but not drastically. 3. Todays average global temperatures top those of the MWP. Correct me if I got any of that wrong, or missed anything.
    0 0
  10. @WSteven- I couldn't figure out the answers to all those on a first read, either. The article is in serious need of a rewrite, as this lack of clarity illustrates. Remember people: our target audience does NOT have the patience to work hard to learn what they do not want to know in the first place. Monckton is very skillful at exploiting this factor, we are not being so skilled. That, BTW: is why Monckton doesn't have to care that he is contradicting another of his 'skeptic' arguments. He knows his target audience neither knows nor cares.
    0 0
  11. WSteven, I'm not sure I'd describe it that way. There's some evidence for MWP in other regions, with most areas warmer than the LIA, but with varying degrees of magnitude. The north Atlantic and southern Greenland were particularly warm. There's also evidence of a la Nina-like pattern, with relatively cooler waters in the tropical Pacific. Was There a Medieval Warm Period
    0 0
  12. WSteven, this article is about the myth that the IPCC 'disappeared' the MWP, as the introduction states. I would summarize the article thusly: 1) The IPCC never said that the average global temperature was hotter during the MWP than today. 2) As more temperature reconstruction studies were done, the IPCC incorporated their results, which showed that today's global temperature is higher than the MWP peak. The IPCC has been very clear and explicit about this. 3) Arguing for a hotter MWP is also arguing for higher climate sensitivity. There are some other minor points I touched on, like the fact that the MWP was mostly hot at high latitudes, but to learn more about that you'll have to click the links (there's a reason I provide links!). MattJ - I suggest you work on making your criticisms more constructive.
    0 0
  13. Hard to tell because of the non labelling of the axes, but it would appear from the current( black line) data....that we are looking at a 1000 year record with variability of less than one degree centigrade. Calling climate sensitivity low, hardly seems like a leap.
    0 0
  14. Mozart@13 I do not understand to what you are referring. The axes are clearly labeled with year and Temperature Anomaly (DegC wrt 1961-1990.
    0 0
  15. mozart - you can't determine sensitivity without knowing what the radiative forcing over the period in question was. If the forcing was small, a small temperature change doesn't tell you that sensitivity is small. I recommend you click the final link in the article and read the associated article.
    0 0
  16. @dana1981: Okay, point 1 I think I did pick up on somewhat. Points 2 and 3 I should have picked up on as on rereading the article they were actually fairly explicit. That's what I get for trying to carefully read an article when I'm busy. :-) Thanks for clarifying. @NewYorkJ: I've actually read that article. I'll probably make a point or reading it again plus the links in Dana's article.
    0 0
  17. pbjamm: mozart is referring to Figures 1 and 2, which are not labeled in-figure for the temperature scale (though it is stated below that the tick marks are separated by a degree Celsius, in the Figure 2 description - I think mozart was aware of this). There are no intermediate ticks, so it's hard to quantify very accurately just by looking at it. But to explain the point he brought up, sort of repeating Dana's response, the climate sensitivity is usually represented as a temperature response to a doubling of CO2. CO2 levels were most certainly not double 280ppmv for any extended period of time during the MWP, so the temperature rise would not have gone up because of them - also, now more along the lines of what Dana said, the overall forcing change during that time period was not particularly high, when compared with the amount expected from a doubling of CO2.
    0 0
  18. Not to imply that the MWP was due to CO2 - just trying to provide something to compare the forcing of that time period to. If I'm not mistaken, the climate sensitivity would be about 0.8 W/m^2, and the forcing during the MWP was about 0.3 W/m^2. In other words, it does not measure up to the customary representation of climate sensitivity.
    0 0
  19. Huh, not sure why I said 0.8W/m^2. Perhaps I was thinking of the temperature rise realized currently, or mixed up the forcing expected from modern CO2 levels which is 1.8W/m^2..... From the "CO2 Effect is Weak" argument the forcing from a doubling of CO2 (climate sensitivity) is 3.7 W/m^2. dF = 5.35ln(C/C_i); 5.35ln(2) = 3.7 The forcing during the MWP was, again, much lower. Sorry about the confusion, hope that clarified some.
    0 0
  20. Alex, just correct to 0.8 deg C per W/m^2 of forcing and I think you will have it about right.
    0 0
  21. I've not the least mystified by the culling of this 'schematic' from subsequent reports. However, I'm mildly perplexed by the inclusion of such a crap diagram in the first place, particularly as it is tagged "global" when it is actually the central bit of a small country. Talk about the IPCC giving denialists an open goal. They'll still be banging on about this when the Himalayan glaciers are lapping round their ankles in 2035. Doh!
    0 0
  22. 21, Xplain, I think you have to put it in context. The first IPCC report, in which this was included, was completed in 1990. There wasn't a whole lot of research to base the report on (in comparison), or even warming (in relation to noise) to give the issue any weight, there was no huge denial movement, a fraction of an Internet by today's standards, and so on. It might look a little silly now, but that shows how much momentum the science has gained in 20 years, and more importantly, how much higher the level of inspection and attention to detail needs to be in an IPCC report. In 1990, I'm not sure if anyone I knew had even heard of the IPCC. And certainly, who knew that the Managerial Wall Period was going to become a rallying cry for an ignorance driven contrarian machine? But by the second report in 1992 this was dropped. I'd venture a guess that, since it was the first report, the authors were simply scrambling for something, anything simple for non-science types to be able to look at without their eyes glazing over.
    0 0
  23. #22 Sphaerica Thanks, but none of that explains why a schematic of 'central England temps' was published as 'global temps'. It's just sloppy. The diagram didn't represent what it claimed to, and like the Himalayan glacier error, undermines public confidence in the IPCC. "who knew that the Managerial Wall Period was going to become a rallying cry for an ignorance driven contrarian machine?" Sure this was pre-denialosphere but I don't think that's any excuse. Take contrarians out the equation: the accuracy of the information published by the IPCC should be to the highest possible standard regardless. It's what we fund them for.
    0 0
  24. XPLAIN@23 A schematic is only intended as a qualitative rather than a quantitative description - if at the time the MWP was considered likely to be a global phenomenon, then the schematic for global temperatures and for CET would be the same. This seems to me to be making a mountain out of a molehill.
    0 0
  25. #23 XPLAIN: Thanks, but none of that explains why a schematic of 'central England temps' was published as 'global temps'. It's just sloppy. The diagram didn't represent what it claimed to, and like the Himalayan glacier error, undermines public confidence in the IPCC. The 1990 report noted that it was not clear whether all the fluctuations indicated were truly global (p 202). How is that sloppy?
    0 0
  26. I know this is slightly OT, but if you would like an excellent discussion of Monckton's Myths (with more to come), go right now to Potholer54 on Youtube (also currently available on Crock of the Week). The guy who prepares these little gems (Peter Hatfield) is a retired(?) journalist who was a regular correspondent for New Scientist. His material deserves a much wider audience.
    0 0
  27. The MWP is is alive and well and it is shown in AR4. Northern hemisphere temperature variations from AR4 Figure 6.10c are shown below. I have deleted the instrumental temperature from HadCRUT2v data so that only proxy records are compared. Note that there is a distinct MWP comparable to the current warming period.
    0 0
    Moderator Response: [Daniel Bailey] Yes, if you hide the incline (wherein we've equalled the maximum temperatures reached in the Holocene Altithermal), then a regional temperature excursion like the MWP does become more evident. Do you have a point with this exercise?
  28. Moderator, I thought that my point was obvious - when you use AR4 Figure 6.10c you get a pronounced MWP, which is similar to the recent warming period. I am not sure what you mean when you state "if you hide the incline". I have hidden nothing. I just removed instrumental data to compare proxy records with proxy records, i.e., I compare "apples with apples".
    0 0
    Moderator Response: [DB] First you remove the most accurate temperature record we have. Second you compare an event specific to the Northern Hemisphere from hundreds of years ago and pronounce it "similar" to the modern rise in temperature (which is not restricted to just the Northern Hemisphere) - which you no longer show. Hence my statement about your hiding the incline and thus my question about your point. Read this post to gain some insights into the MWP. And third, the temperature rise since 1980 or so is largely attributed to the rise in greenhouse gases, principally CO2, which are sourced to our burning of fossil fuels. Since this option (anthropogenic CO2) was not available during the MWP, you are comparing apples to non-apples.
  29. Even if we ignore the fact that this is NH data only, then what I see, Angusmac, is a roughly 0.6 degrees of warming between the period of 600 AD & 1000AD (though the actual dates might be very different)-to put that in context, this represents a rate of change of +0.15 degrees *per century*. By contrast, the warming of the last 60 years has been at a rate of +0.12 degrees *per decade*-a rate ten times *faster* than during the MWP. Not only that, but paleo-climatologists have identified clear forcings responsible for the MWP (primarily a sustained, multi-century rise in solar activity, as determined from Be-10 & C-14 isotope analysis.) By contrast, the last 60 years of warming has been against a backdrop of relatively low solar activity & relatively high levels of volcanic activity. So, in fact, your comparisons are totally odious.
    0 0
  30. Moderator, please note that I stated that the proxies were for the NH, at no time have I stated otherwise. Furthermore, we should compare proxy temperatures with proxy temperatures not instrumental records. Personally, I do not care if the temperature in 1010 was slightly hotter or colder than 2010 but we should compare like with like. It is statistically and physically incorrect to compare recent instrumental temperatures with 1000-year old proxies. Marcus, from Figure 6.10c, the rate of rise in proxy temperatures from approximately 950 to 1000 looks very similar to the rate of rise in proxy temperatures from 1940+ but I do not have the original data to make a more accurate comparison. I disagree that my comparison is odius. You have stated other factors appear to have caused the MWP and I do not disagree with these other factors but the fact remains that the MWP was relatively warm (in the NH at least). Why haven't the proxies been updated so that we can compare recent proxies with the 1000-year old proxies? This would also allow comparison between recent proxies and recent instrumental records. I reiterate that Figure 6.10c of AR4 shows similar proxy temperatures 1000 years ago to the most-recent present-day proxies. If anyone has a problem with that then please contact the IPCC; they produced the diagram not me.
    0 0
  31. "Marcus, from Figure 6.10c, the rate of rise in proxy temperatures from approximately 950 to 1000 looks very similar to the rate of rise in proxy temperatures from 1940+ but I do not have the original data to make a more accurate comparison." What you need to remember, though, is that the proxies used above are far from accurate. Each proxy is done using different methods & using materials sourced from different locations-& what we seem to have above is a composite of several of the most well-known proxies (Mann, Moberg & Esper). The original data for each proxy seems to contain a lot of noise but, what seems to come through is a definite warming trend from around -0.6 degrees below the 1961-1990 mean up to around +0.1 degrees above the 1961-1990 mean-over the space of around 600 years-driven largely by a significant increase in sunspot activity. By comparison, the warming of the late 20th century is occurring *on top of* the warming already caused by the increasing solar activity of the previous 200-odd years (from around 1750 to 1940). The warming is also occurring during a period of relative solar quiescence & relatively high volcanic activity-both of which should be producing *cooling*, not warming. Hope that makes sense.
    0 0
  32. RickG: “The 1990 report noted that it was not clear whether all the fluctuations indicated were truly global (p 202). How is that sloppy?” You may notice that note applies to a range of 3 different schematics for 3 different periods. It may bear some relevance to the other two but as for the schematic in question (7.1c) then you’d be spinning a line as it was clear that NONE of the fluctuations from that one were truly global! Seeing as you ask I’ll respond to the ‘sloppy’ bit: but first some context courtesy of the IPCC FAR: “The issues confronted with full rigour include history of the Earth’s changing climate. The result is the most authoritative and strongly supported statement on climate change that has ever been made by the scientific community.” So, on the subjective question of what constitutes ‘sloppy’ at the IPCC please bear in mind they set their own bar to the fullest rigour possible. To the question “how is that sloppy?” It’s sloppy because the schematic is labelled ‘global’ when it was actually, as the above article makes clear: “based on Lamb's approximation of the central England temperature. It was intended only as a schematic diagram, and known not to accurately reflect the global average temperature.” ...but it was still presented as a curve of ‘global temperature variations’. And I don’t care if it’s a schematic, or rock art. That’s just a red herring. In effect; ‘we knew all along that the data for Central England wasn’t great, and wasn’t representative of global or even NH. But it’s all we had so we used the curve anyway and downgraded it from a graph to a schematic to cover our arses’. I find this most unsatisfactory. What isn’t clear is: did the IPCC know that this schematic reconstruction was solely based on Central England or not? As (contributor to that section) Prof Jones himself says: “Many in the palaeoclimatic community have known that the IPCC graph was not representative of global conditions (even when it first appeared)...Greater amounts of documentary data (than available to Lamb in the early 1970s) were collected and used in the Climatic Research Unit in the 1980s.” This begs the question, why use Lamb as a basis to extrapolate a global picture or even reproduce his curve at all? Nor is it clear whether - in the absence of something global to give us - the authors of section 7 simply took a reconstruction of Central England and presented it to us as “global”, or maybe due to sloppy fact checking they used the schematic in good faith having lifted it from the UK DoE 1989 publication ‘Global Climate Change’. Either way I consider this to be sloppy. I certainly wouldn’t describe it as an ‘issue confronted with full rigour” even back in that huge vacuum of climatic knowledge that was 1990.
    0 0
  33. Dikran: “This seems to me to be making a mountain out of a molehill.” It’s just possible that back in 1990 someone at the IPCC made a comment similar to mine and someone else there made a comment similar to yours ;-)
    0 0

You need to be logged in to post a comment. Login via the left margin or if you're new, register here.


The Consensus Project Website

THE ESCALATOR

(free to republish)


© Copyright 2024 John Cook
Home | Translations | About Us | Privacy | Contact Us