Climate Science Glossary

Term Lookup

Enter a term in the search box to find its definition.

Settings

Use the controls in the far right panel to increase or decrease the number of terms automatically displayed (or to completely turn that feature off).

Term Lookup

Settings


All IPCC definitions taken from Climate Change 2007: The Physical Science Basis. Working Group I Contribution to the Fourth Assessment Report of the Intergovernmental Panel on Climate Change, Annex I, Glossary, pp. 941-954. Cambridge University Press.

Home Arguments Software Resources Comments The Consensus Project Translations About Support

Bluesky Facebook LinkedIn Mastodon MeWe

Twitter YouTube RSS Posts RSS Comments Email Subscribe


Climate's changed before
It's the sun
It's not bad
There is no consensus
It's cooling
Models are unreliable
Temp record is unreliable
Animals and plants can adapt
It hasn't warmed since 1998
Antarctica is gaining ice
View All Arguments...


Username
Password
New? Register here
Forgot your password?

Latest Posts

Archives

Nature Confirms Global Warming and Temperature Record Accuracy

Posted on 12 January 2013 by dana1981

Climate contrarians frequently dispute the accuracy of the instrumental surface temperature record, as is evident by the fact that this argument comes in at #7 on our list of most used climate myths.  In fact, we recently pointed out the fundamental errors in a draft paper which disputed the temperature record's accuracy.

A new paper published in Geophysical Research Letters by Anderson et al. (2012) tests this myth by creating a new global surface temperature record reconstruction using records from 173 natural temperature-sensitive changes (in corals, ice cores, speleothems, lake and ocean sediments, and historical documents), with 67 of these records extending as far back as 1730.

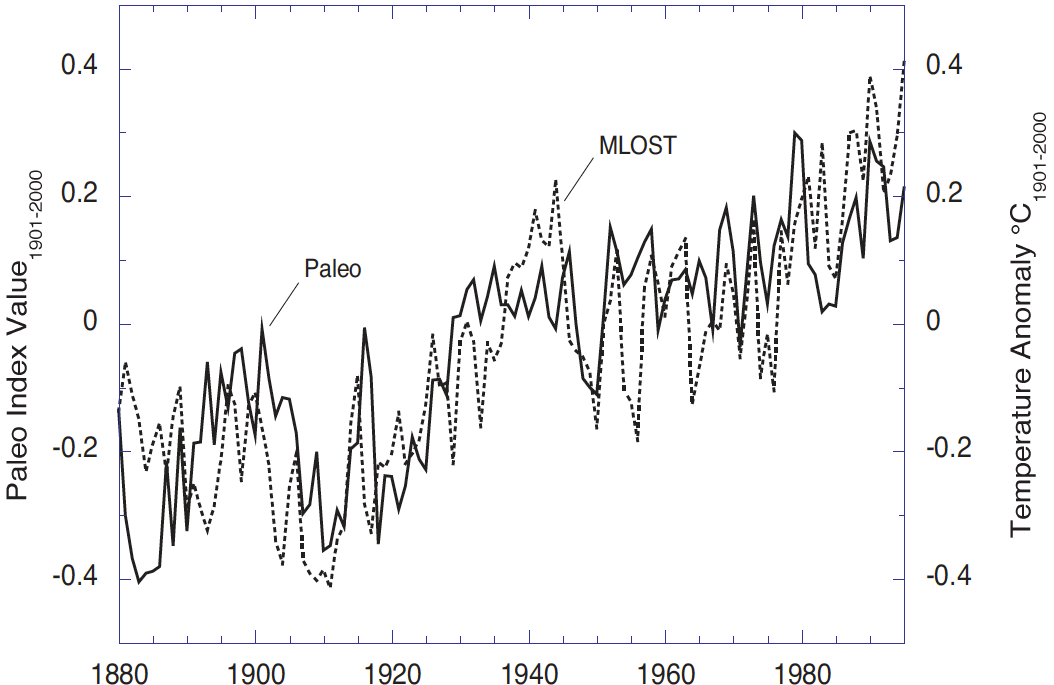
The paper compares their natural temperature reconstruction (Paleo; solid line in Figure 1) to the instrumental surface temperature record (MLOST; dashed line in Figure 1) and finds a strong correlation (of 0.76) between the two.

Fig 1

Figure 1: Paleo Index (solid) and the merged land-ocean surface temperature anomalies (MLOST, dashed) relative to 1901-2000. The range of the paleo trends index values is coincidentally nearly the same as the GST although the quantities are different (index values versus temperature anomalies °C).

Overall, Anderson et al. concludes,

"From 1880 to 1995, the index trends significantly upward, similar to the GST [global surface temperature record]. Smaller-scale aspects of the GST including two warming trends and a warm interval during the 1940s are also observed in the [paleo reconstruction]....The upward trend appears to begin in the early 19th century but the year-to-year variability is large and the 1730–1929 trend is not significant."

Data and Methods

Anderson et al. selected natural records with some type of physical or biological link to global surface temperatures (proxies).  The records they chose contained at least ten samples between 1880 and 1995 in order to achieve decadal resolution.  Of the records used in the paper, 40 have decadal resolution, and the remaining 133 have even better annual resolution.  Tree rings (which are often used as temperature proxies) were excluded because use of tree ring proxies can result in loss of short-term variations in the data, due to the de-trending process employed in using them as a temperature proxy.

Based on the availability of the records, the paper reconstructs proxy temperatures between 1730 and 1995.  Although there are other natural environmental influences on each individual natural proxy besides global surface temperture, the assumption is that by averaging so many records together, these other influences will be minimized, leaving a reasonable approximation of global surface temperature changes.

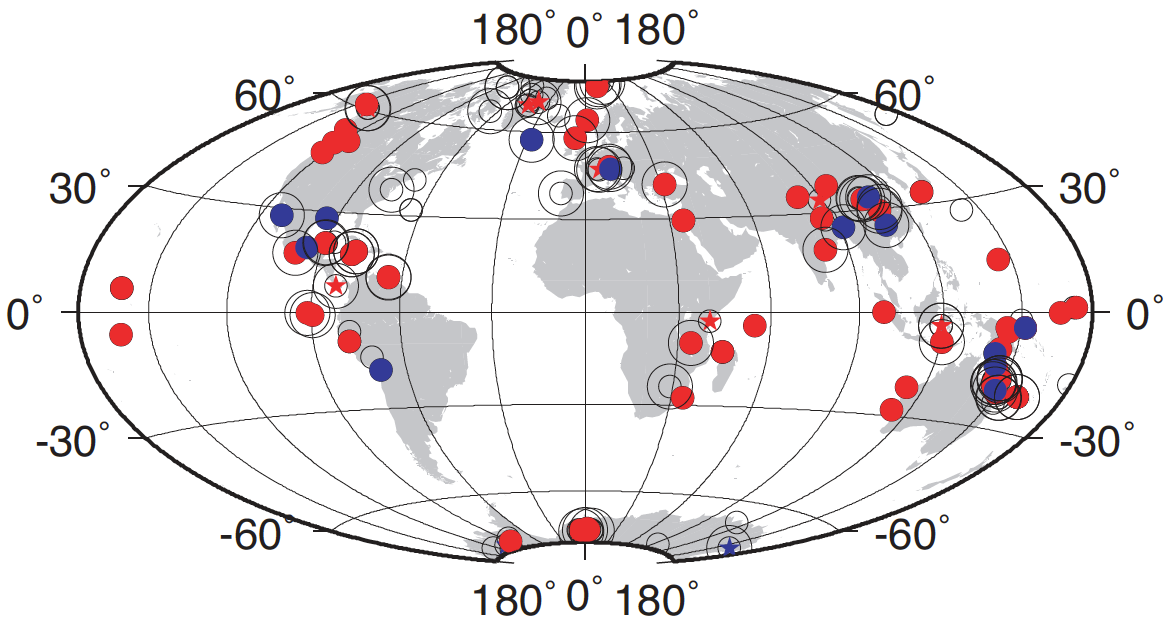
The locations of the proxy datasets are shown in Figure 2.  Red circles are measurements with a significant warming trend from 1880 to 1995, red stars are less significant trends, open circles show no trend, blue circles are locations with significant cooling trends, blue stars with less significant cooling trends, and double circles show the records which extend as far back as 1730. 

proxy locations

Figure 2: Sites with significant warming trend 1880-1995 (red, p<0.05), less significant trend (red star, 0.05<p<0.20) trend, and no significant trend (open circle, p>0.20); also sites with a significant cooling trend (blue, p<0.05) or less significant cooling trend (blue star, 0.05<p<0.20). Double-circles show 67 sites extending to 1730.

Results

"Thus, using only temperature-sensitive paleo proxy records un-calibrated to instrumental data, it is possible to conclude that the warming trend in the [instrumental temperature record] is supported by independent evidence."

As shown in Figure 2, records all around the planet show significant warming trends.   As the authors note,

"The significant positive (warming) trend is widespread, found in Arctic, sub-polar, temperate, and tropical sites....Therefore, the distribution of the paleo sites supports the global extent of warming observed in the instrumental record."

As shown in Figure 1, Anderson et al. creates its own "Paleo Index Value" which it does not convert to temperature units, but rather examines the correlation with the surface temperature record trend (from NOAA NCDC).  The paper finds a strong correlation of 0.76 between the two records and concludes,

"Thus, using only temperature-sensitive paleo proxy records un-calibrated to instrumental data, it is possible to conclude that the warming trend in the GST is supported by independent evidence."

The warming trend in the Anderson reconstruction is larger from 1920 to 1935 (0.260 ± 0.056 units per decade) than from 1980 to 1995 (0.071 ± 0.015 units per decade), but the same is true in the instrumental record (0.115 ± 0.132°C vs. 0.087 ± 0.138°C per decade, respectively).  However, when we include instrumental data post-1995, the recent warming trend becomes larger than the early 20th century warming trend in the instrumental record.

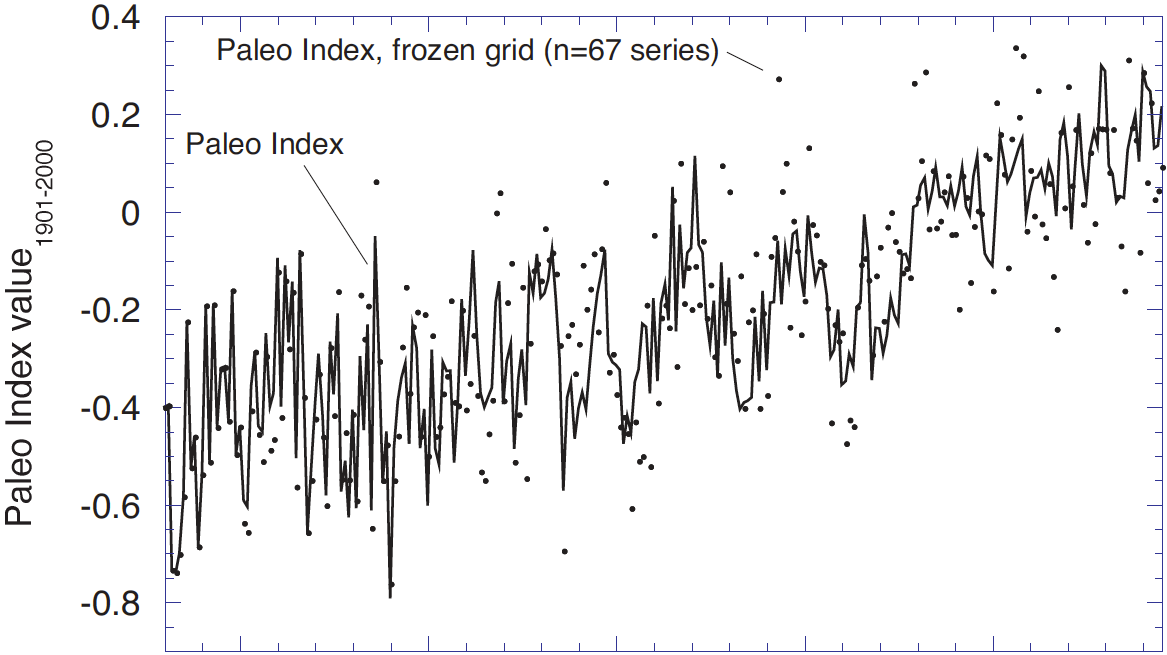
Examining the temperature reconstructions which extend furthest back in time, the paper also confirms that the planet is now hotter than it has been in at least the past 280 years (Figure 3).  They also find a very small, insignificant warming trend from 1730 to 1928 (0.001 ± 0.004 units per decade), with the slight warming beginning around the year 1800.

Anderson Fig 2

dates

Figure 3: Paleo temperature reconstruction index extending back to 1730 (solid line), derived by averaging only the sites that begin prior to 1730 (dots).

Summary

Overall this new nature-based temperature reconstruction confirms the main aspects of the global surface temperature record.  There was a warming event in the early 20th century, after which surface temperatures were relatively flat until the late 20th century, at which point there was another warming event.  The 1920–1935 warming was larger than the 1980–1995 warming, but according to the instrumental temperature record, was smaller than the 1975–Present warming

The strong correlation between the two datasets confirms the general accuracy of the instrumental temperature record.

This natural temperature reconstruction also shows there has been significant warming all around the planet over the past century, and that current global temperatures are higher than they have been in at least the past 280 years.

Note: this post has been used to update the rebuttals to the myth that the instrumental temperature record is unreliable.

0 0

Printable Version  |  Link to this page

Comments

Comments 1 to 10:

  1. One picture is a 1000 words or so... http://xkcd.com/54/
    0 0
  2. But while it may confirm the trend, doesn't it show significantly less warming? If you take the end points, roughly half-as-much (0.2 instead of 0.4).
    0 0
  3. sotolith7 #2 The chart (Figure 1) is relative to 1901-2000. Americal Meteorological Society statement on climate change gives 0.8C warming 1901-2010, with 0.5C of that coming since 1979. The chart appears consistent with the AMS statement.
    0 0
  4. @ sotolith this is why end points are not used. if the analysis started or ended at slightly different years you could come to the exact opposite conclusion (if you used end points). the trend is important, the wiggles are not
    0 0
  5. This is off-topic as I can no longer find an email link to a moderator. Delete as necessary. Lomborg has a new red herring piece on Slate which makes light of climate change related reductions in crop yields LINK Can this be rebutted and is there someone to do it? Pass the linguine? The best to you all in the New Year. yours Frank Johnston
    0 0
    Moderator Response: [RH] Hot linked URL that was breaking page formatting.
  6. fpjohn @5 - we will have a rebuttal to a similar argument by Ridley and Murdoch this upcoming week. If I have time I'll try to incorporate some of Lomborg's nonsense. Unfortunately the deniers have been very busy writing BS media articles lately, and it's very hard to keep up.
    0 0
  7. fpjohn @5, as you yourself have noted on another thread, this article rebutted Lomborg's latest before it was even published.
    0 0
  8. Hi everyone. I'm a long time reader, first time commenter so please... go easy on me. :P I have a question about the assertion made by this post's title and reworded in Dana's summary with the following statement:

    "The strong correlation between the two datasets confirms the general accuracy of the instrumental temperature record."

    This seems backwards to me. Of course, uncertainty exists in both types of datasets. However, isn't there greater uncertainty in the various proxy records than in the GTS and therefore this particular correlation would instead primarily strengthen confidence in the usefulness and accuracy of these proxy records? Am I wrong in thinking that the GTS is more robust than these individual proxy records? Maybe there is something else that I'm missing? I'm genuinely open to each possibility. Just trying to understand. Regardless, the figures are compelling and, assuming the methodology is robust,** the results do seem to lend even more credence to these types of proxy records... and secondarily, further verifying the instrumental record. ** Not trolling with the methodology comment. There's no reason to think otherwise but I'm always cautious to accept results without having seen the data myself. That's just how I roll. ;)
    0 0
  9. Tron Carter @8, you are exactly correct. The non-instrumental record is less reliable both because individual proxies respond to environmental factors in addition to temperature, and because the combined record has very few proxy series. Consequently there is very good reason to consider the instrumental record more accurate. However, for political reasons some people doubt, or purport to doubt, the accuracy of the instrumental record. This study is interesting, therefore, in that it shows their doubts for what they are - political posturing. It is also scientifically interesting in that it determined the temperature record without calibration. This holds the prospect of developing paleo-proxy series to determine past temperatures relative to modern ones without vexatious issues related to calibration.
    0 0
  10. Tron: Two old sayings (just to get started on an up-beat pace) - a person that has one watch always knows what time it is. A person with two watches is never quite sure. [They won't agree - which is right?] - when two measurements disagree, the most you can say is that at least one of them is wrong. [Both may be wrong.] ...but, to dissect the statement you are asking about, first let's consider the part that says "confirms the general accuracy of". The accuracy of the thermometer-based temperature record can be examined by looking at the details - the calibration of thermometers, placement, exposure (e.g. protection from radiation errors, etc.), regional sampling errors, etc. This has all been well-studied and overall the results are good. People keep studying this, and keep making tiny adjustments to methods of correcting known or newly-discovered errors, but these effects tend to be small. This tells us that the results are reliable. But how do we do another check? If you set up the same type of thermometers, in the same places, with the same exposure, and the same regional sampling, then getting the same result is not going to make you all that much more confident. [As an aside, that is why the BEST project is not considered by many to be ground-breaking: it's just a new way of combining the same numbers - a new mathematical combination. Contrast that check with another: one that doesn't use thermometers, uses different places, with different exposure issues, and different regional sampling. If this comes up with a different result, then you might say "hmmm. I wonder what is going on? What time is it, really?" One possibility would be that the instrumental record has larger errors than we thought. On the other hand, if it comes up the same result, then you are going to think "hey! This seems pretty robust. A completely different approach, yet it still shows the same trends. Perhaps we really do know what time it is!" Note the statement in the yellow box: "that the warming trend in the [instrumental temperature record] is supported by independent evidence." The "independent" part is important. Yes, it confirms the usefulness of the proxy, because we already had confidence in the instrumental temperature record. But it also increases confidence in the instrumental temperature record, because the proxy was developed independently. We're not making a copy of the watch, or calibrating to match the watch - we're determining time from something completely different, and coming up with the same answer.
    0 0

You need to be logged in to post a comment. Login via the left margin or if you're new, register here.


The Consensus Project Website

THE ESCALATOR

(free to republish)


© Copyright 2024 John Cook
Home | Translations | About Us | Privacy | Contact Us