Global cooling: the new kid on the block
Posted on 4 March 2008 by John Cook
A new argument is hurtling up the Skeptic Leaderboard, leaving old stalwarts like mid-century cooling and water vapor in its wake. The argument is that global warming has reversed and we're now undergoing global cooling. No, it's not the old chestnut global warming stopped in 1998. The new contention is that global warming stopped in January 2007.
The argument originated from Anthony Watts who plotted data from 4 sources (HadCRUT, GISS, RSS and UAH), all of which show sharp cooling of around 0.6°C from January 2007 to January 2008. The most common interpretation around the blogosphere is that the long term global warming trend has reversed. Daily Tech goes so far as to say 2007 "wipes out a century of warming".

Figure 1: global temperature anomaly from HadCRUT (graph courtesy Anthony Watts).
The flaw in this interpretation is in drawing conclusions about long term climate change over a relatively short period of 13 months. Particularly when a large portion of that cooling occured over one month (January 2008). Only over a period of years to decades can you confidently discern climate trends. Otherwise, you run the danger of mistaking weather for climate.
Nevertheless, several important questions remain - what's causing this sudden cooling and is it the start of a long term trend?
Is the sun driving global cooling?
The general consensus among skeptic blogs is that diminished solar activity is the cause. The sun is currently at solar minimum - cycle 23 just ended and cycle 24 is having trouble kicking along. It's as cool as it gets in the solar cycle.
However, a temperature drop of 0.6°C would require a dramatic reduction in Total Solar Irradiance (TSI). According to theoretical calculations at Atmoz, TSI would need to fall to 1347.65 W/m2 to produce a global cooling of 0.6°C. In other words, 13 W/m2 less than current levels. This is ludicrously large considering the solar cycle varies only around 1.3 W/m2.
Alternatively, Camp 2007 adopts an empirical approach to calculate solar influence on global temperature. He determines the solar cycle contributes 0.18°C cooling to global temperatures as the sun moves from maximum to minimum. Note - this includes any influence due to cosmic rays as TSI closely correlates with the solar magnetic field which modulates cosmic radiation. Employing back of a napkin calculations, TSI would need to fall roughly 4.3 W/m2 to provide 0.6°C of cooling.
Either way, TSI needs to drop considerably to be considered the driver of 2007 cooling. So what has the sun been doing over the last few years?

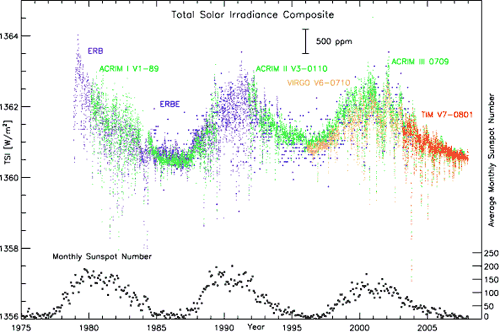
Figure 2: TSI Composite and Sunspot Numbers (graph courtesy Greg Kopp).
Satellite measurements show no dramatic drop in TSI over the past several years. Instead, the solar cycle is following its usual 11 year cycle, flattening out as it reaches solar minimum. So if not the sun, what's causing the cooling?
La Niña - the likely culprit
Currently, the Pacific Ocean is in a La Niña phase. During La Niña, cold waters upwell to cool large areas of the equatorial Pacific Ocean. This has the effect of cooling the atmosphere. During the La Niña episode of 1999, global temperatures dropped around 0.5°C.
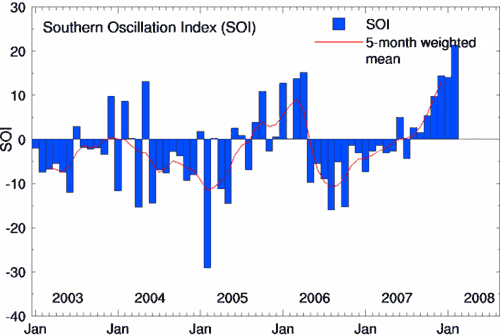
The Southern Oscillation Index (SOI) is a measure of La Niña. Positive SOI corresponds to a La Niña phase. In 2006, the Pacific Ocean was in El Niño phase (negative SOI). However, in late 2006, El Niño subsided and in mid 2007, crossed into La Niña phase. La Niña peaked around January 2008 and is the strongest La Niña since 1999. In the Eastern Pacific, sea-surface temperatures are about two degrees colder than normal over an area the size of the United States.

Figure 3: Southern Oscillation Index (graph courtesy bom.giv.au).
Future predictions for global cooling
The UK Met Office predict the cooling effect of La Niña will be slightly greater in 2008 than it was during 2007. According to NOAA’s Climate Prediction Center, the current La Niña episode is expected to start weakening in February 2008. The moral of the story - don't use short term weather patterns to draw conclusions about long term climate trends. My prediction is the current global cooling trend will reverse around mid-2008 when La Niña subsides. That's a bit vague though - feel free to go out on a limb and post a comment with your own prediction of the following months.
Meanwhile, solar cycle 24 is expected to crank up later this year so over the next 5 years, the global warming trend will accelerate as increasing solar activity adds to CO2 warming. So enjoy the cold while it lasts. Personally, I'm strongly considering a skiing holiday.
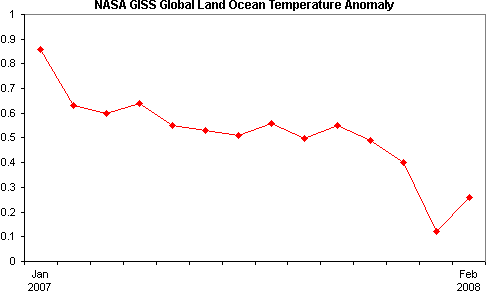
Update 13 March 2008: NASA GISS have updated the Land Ocean Temperature Index. February 2008 shows a global temperature increase of 0.14°C from January 2008. Not as much as John Cross predicted but more than I expected - I thought La Nina cooling might continue for at least a few more months. Probably a bit early to say La Nina cooling has reversed though - will be interesting to see March's figures.

UPDATE 9 April 2008: I've updated the monthly temperature with March's data at La Nina watch: March update (also busied up the graph with Southern Oscillation Index data).


 Arguments


So Camp 2007 empirically compares the solar cycle to global temperatures. The cosmic radiation cycle is the same as the solar cycle. He doesn't do any modelling on solar warming or cloud albedo - it's purely a statistical analysis to see whether there's a statistically significant pattern in global temperature that matches the solar cycle. And he finds a strong solar signal in global temperature - 0.18 degrees worth.
So basically, when Camp calculates the solar influence on global temperature, he includes the whole kit and kaboodle - TSI, UV, cosmic rays - it's all bundled in one big solar package. Note - I've never said cosmic rays don't affect climate but that the cosmic ray trend doesn't correlate with global temperatures.
Re my post on ocean warming, I wasn't denying the El Nino warming influence. Of course El Nino warms the atmosphere as the spike in 1998 shows. In fact, I say the opposite - that phenomena like El Nino demonstrate how oceans transfer heat into the atmosphere.
But more importantly, the long term, decadal trend of solar activity does not correlate with global temperatures. This applies to Total Solar Irradiance, Cosmic Radiation, UV and X-Rays. However, I haven't looked at data on CMEs and SPEs - I imagine as they correlate with other indices of solar activity, they would show a similar lack of correlation with climate.
The most striking feature is that sun has correlated so closely with temperature over the past 1,500 years and yet just in the last 3 decades has diverged so sharply (Usoskin 2005).
Even worse is their use of Lassen's 1991 solar cycle length graph. In 1999, Lassen updated his data concluding "since around 1990 the type of Solar forcing that is described by the solar cycle length model no longer dominates the long-term variation of the Northern hemisphere land air temperature". The 1991 data is erroneous and to use it when even the author has debunked his earlier work is misleading or at best, ignorant.
It's a pretty good match (which isn't surprising, Krivova 2007 does make a point of checking their reconstruction against the satellite data). Last year, I did ask Solanki if he could upload their TSI data to his website (so I could provide a link to it). He said he'd run the idea by Krivova but I'm guessing they never got around to it. I'd be happy to email you the Solanki data if you're interested.