Climate Science Glossary

Term Lookup

Enter a term in the search box to find its definition.

Settings

Use the controls in the far right panel to increase or decrease the number of terms automatically displayed (or to completely turn that feature off).

Term Lookup

Settings


All IPCC definitions taken from Climate Change 2007: The Physical Science Basis. Working Group I Contribution to the Fourth Assessment Report of the Intergovernmental Panel on Climate Change, Annex I, Glossary, pp. 941-954. Cambridge University Press.

Home Arguments Software Resources Comments The Consensus Project Translations About Support

Bluesky Facebook LinkedIn Mastodon MeWe

Twitter YouTube RSS Posts RSS Comments Email Subscribe


Climate's changed before
It's the sun
It's not bad
There is no consensus
It's cooling
Models are unreliable
Temp record is unreliable
Animals and plants can adapt
It hasn't warmed since 1998
Antarctica is gaining ice
View All Arguments...


Username
Password
New? Register here
Forgot your password?

Latest Posts

Archives

Climate Cherry Pickers: Falling sea levels in 2010

Posted on 3 October 2010 by John Cook

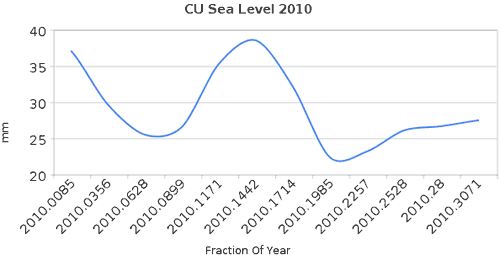
A proper understanding of climate requires we consider all the data, the full body of evidence. A common rhetorical technique used to portray a skewed picture is the technique of cherry picking. This involves choosing just the select pieces of data that paint a certain picture, even if the full body of evidence gives the completely opposite result. A vivid example of this is a recent post by Steve Goddard which casts doubt on the fact that we've experienced record hot temperatures over the last year, citing falling sea levels in 2010. This is based on the following graph showing satellite measurements of sea levels over 2010:
The satellite data comes from the University of Colorado - you can download the data directly. This data goes back to 1992. Here's what the full body of evidence looks like:
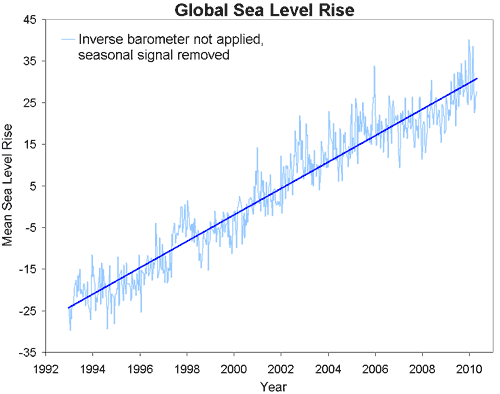
Early in 2010, global sea levels hit the highest levels on record. Realising this fact is not possible when the only data presented is the following:
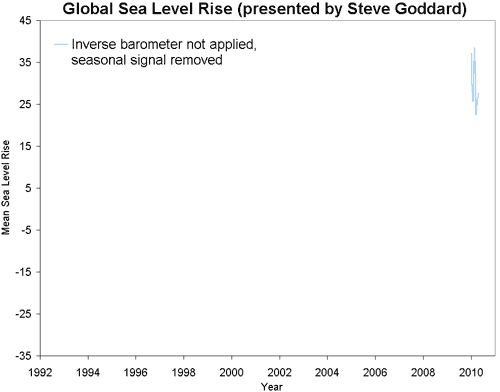
Of course, there's a lot more that can be picked apart in Goddard's blog post (and readers are welcome to contribute to this process). There's no discussion of why sea levels might be dropping this year (I suspect it has something to do with the switch from El Nino conditions in early 2010 to La Nina conditions in the middle of the year). There is no exploration of what other factors besides air temperature contribute to glacier ice loss - Robert has explained the complexities of why glaciers loss mass here, here and here.

Instead all we are presented with is strong conclusions drawn from a very short piece of climate data. This is taken from a noisy signal showing many ups and downs throughout the long-term trend of sea level rise. A proper understanding of climate deserves much more than this.

0 0

Printable Version  |  Link to this page

Comments

Prev  1  2  3  

Comments 101 to 112 out of 112:

  1. BP, Please respond to the questions that I posed to you at #89. Thanks. And your reference to Church is a red herring, and I would argue that you are misrepresenting their findings with the quote that you chose to produce here. How about we quote the relevant part of their abstract? "While sea levels have varied by over 120 m during glacial/interglacial cycles, there has been little net rise over the past several millennia until the 19th century and early 20th century, when geological and tide-gauge data indicate an increase in the rate of sealevel rise. Recent satellite-altimeter data and tide-gauge data have indicated that sea levels are now rising at over 3 mm year-1. The major contributions to 20th and 21st century sealevel rise are thought to be a result of ocean thermal expansion and the melting of glaciers and ice caps. Ice sheets are thought to have been a minor contributor to 20th century sea level rise, but are potentially the largest contributor in the longer term. Sea levels are currently rising at the upper limit of the projections of the Third Assessment Report of the Intergovernmental Panel on Climate Change (TAR IPCC), and there is increasing concern of potentially large ice-sheet contributions during the 21st century and beyond, particularly if greenhouse gas emissions continue unabated." Also, Church did not, as far as a can see, simply extrapolate a linear line to estimate sea levels circa 2100. The sea-levels circa 2100 were based on model projections with and without dynamic processes. Their Fig. 6 shows that sea levels are rising faster than predicted in TAR. Actually, it seems that each time the estimates are updated for sea levels they are higher , not lower, then previous projections. For example, the recent projections made by Vermeer and Rahmstorf (2009). Let me remind you BP, as far as changes in SL goes, it is still very early days, and the rise is not going to suddenly stop circa 2100.
    0 0
  2. BP #97 "Departure from a linear trend may not be significant, but it is not accelerating either." Well strictly speaking you're making that conclusion due to a limitation in the methodology of regression (see this post which demonstrates the staggering lack of power in these univariate not-corrected for the limitations of time series procedures). In order to demonstrate a change to the rate of change you have to use more sophisticated methods than simple two variable regression.
    0 0
  3. So what I might do by way of attempting to demonstrate a change of the rate of change would be to do some multiple regression modeling until i got a reasonable and valid fit. Then I would start entering and removing variables from the model to see if the predictive power changes. Specifically I'd examine the residuals of the model and look for systematic changes in heteroskedascity at the end of the time-series when omitting key variables. A specific pattern of residuals will indicate an acceleration of the line of best fit gradient. Three problems here: Firstly the effect size may be too small over a short period of time relative to the other signal, and noise in the data for this approach to be worthwhile. Secondly this is a quantitative social scientist's approach to what is a physical problem, so there may be better approaches more well suited to this domain. Three, this would be a day or two's work at least, after curating the data (so give it a week) so it ain't going to happen in a science blog.
    0 0
  4. Finally, the nature of the variable(s) that caused this heteroskedascity would be strongly suggestive, but not proof of some kind of causal relationship.
    0 0
  5. BP: The above (posts #101-103) is indicative of how one goes about producing measured conclusions to a set of information. This is as compared to the approach that you take of taking a single piece of information and then over-extending your conclusion to fit your preconception (which is indicitative of confirmation bias rather than of the mechanism under investigation).
    0 0
  6. #101 kdkd at 08:29 AM on 11 October, 2010 Well strictly speaking you're making that conclusion due to a limitation in the methodology of regression (see this post which demonstrates the staggering lack of power in these univariate not-corrected for the limitations of time series procedures). Come on, get real. No amount of statistics would turn a curve like this into an accelerating one, you know it as well as I do.
    0 0
  7. "No amount of statistics would turn a curve like this into an accelerating one, you know it as well as I do." Aah, but BP, some cherry picking and inappropriate data manipulation can change it into a slowing trend or even a decreasing trend ;) Again, I must politely ask you to please reply to my questions posed earlier at #89. They are relevant to this thread. Thanks.
    0 0
  8. BP #105 Accelerated sea level rise seems unlikely from the graph that you present there, but that's only a part of the story. I was just explaining one way of doing the job properly from empirical data. Note this thread is about "falling sea levels" and there don't seem to be claims about accelerating sea level rise. I suspect that we aren't really able to think about global warming caused accelerating sea level rise on an empirical basis yet, although it's quite possible that there's theoretical support for the idea. Again BP, you should use the above to guide the way that you make conclusions from a scientific approach to this topic. You'll note that it's a much more measured, conservative and balanced approach than what we usually see from you.
    0 0
  9. The cherry-picking continues, but this one is on sea ice extent, so here's the more appropriate thread.
    0 0
  10. #107 kdkd at 12:02 PM on 11 October, 2010 there don't seem to be claims about accelerating sea level rise Of course there is one in this very thread. It is based on a post from the same author. "In point of fact, observed sea level rise is already above IPCC projections and strongly hints at acceleration" Or here is another one, this time from Peter Hogarth. "there is a significant weight of evidence of a recent acceleration in rate of sea level rise [...] The weight of peer-reviewed evidence for this acceleration in sea level rise is robust" The meme at this site must have been started by John Cook himself, with an even stronger claim. "So a broader view of the historical record reveals that sea level is not just rising. The rate of sea level rise has been increasing since the late 19th century" Here is a fairly recent one. "Sea-level rise is accelerating faster than the IPCC predicted" These claims are not supported by evidence, still, they keep popping up, undebunked. They are usually connected to alarming projections of even more acceleration in the future (yes, projections, whatever that's supposed to mean, never predictions), based on the alleged accelerating ice loss over Greenland. That acceleration is computed using eight years of GRACE data. Now that's cherry picking. But I can't see it'd meet much opposition here. As for the "scientific approach", University of Colorado at Boulder sea level data are next to useless. They lack error bars completely and the sampling interval is 9.9156 days (several samples missing). It is about one third of a synodic month, but not quite. The difference is 6230 sec (1 h 43' 50''). As the signal itself must contain strong components at multiples of lunar cycle frequency, it looks like an odd choice. The gradual phase shift makes up a full lunar cycle in about 11 years, so on timescales significantly shorter than that it can introduce false trends. This is why Steve Goddard's four month sea level trend does not make sense, not because it is "cherry picking" (it is not, it's just some recent data). It is actually a bit worse than that. He shows data with no inverted barometer correction. If correction is applied, there is no trend whatsoever. Of course in the long run barometric correction should not change the trend at all, because mass of atmosphere is given and there are limits to how uneven its distribution can get before strong winds restore uniformity. But this time span is not sufficiently long. Otherwise there is nothing wrong with the idea that the ocean itself can be used as a global thermometer to check ocean temperature and heat content measurements. This is what Trenberth is trying to do, with not much success so far. The main problems with this ocean thermometer idea is that as we have seen it is not reliable in the short term (neither its long term precision is good enough) and volumetric thermal expansion coefficient of seawater is highly dependent on both temperature and pressure while ocean mass also keeps changing.
    0 0
  11. BP @109, You keep on digging yourself deeper into a hole. 1) Let me remind you again that this thread is about Goddard cherry-picking, and make no mistake he is cherry picking. He clearly chose those data (failing to apply the inverse barometer correction) to support his claim that "Sea level falling in 2010". 2) You say that his analysis (if one could venture to call it that) "does not make" sense. Please, don't insult our intelligence BP, you know very well the game that Goddard is playing. The fact that you are not willing to call him on it is inexcusable, and flies in the face of you assuring me a while ago that you are interested in the pursuit of truth. 3) Let me remind you that nowhere in his post did John refer to accelerating increase in SL rise over the satellite record. And you are misrepresenting what Doug said in his post @ 42. He said "TTTM, look at this graph. Notice, sea level sort of bounces along, upward". Nothing about acceleration of the rate of SL rise over the satellite record. You and Ken are arguing a strawman. 4) Now that you have introduced the strawman about rate of SL rise not "accelerating", you give a wonderful piece of curve fitting at #49. First, 2010 is not over yet (in fact the UofC data only go back to June or so), so I am not sure what you mean when you claim that the rate of increase in global SL in 2010 is 1.9 mm/hr. Additionally, you do not support any statistics to support choosing the quadratic model versus a linear model. I have processed the UofC data in MINITAB-- for the linear model over the satellite record the R-sqd =0.934 (p-value <0.001; S=4.02); for the quadratic model the R-sqd is 0.938 (p-value <0.001; S= 3.84). I also plotted the residuals, there is not much at all to choose between the two models used to fit the data. Therefore, I can see no statistical justification of why one would feel compelled to choose a quadratic model versus a linear model. Moreover, there is no reason to expect that the quadratic model will be valid beyond the training period, but I am willing to bet that the linear model does have some skill beyond 2010. How about we revisit in 2015? That all said, I agree that over the duration of the satellite record there is no evidence of an acceleration in global SL. 5) The CSIRO data up until August 2010 just came in, they show that the mean rate of increase in global SL over the satellite record is 3.2 mm/yr. Now let us place this in context. Historic data show that the rate of increase in global SL early in the 20th century was about 1.7 mm/hr (Church et al. 2008), with "with an increase in the rate of rise over this period". Church et al. (2008) note that Jevrejeva et al.(2006)used a different technique but obtained a similar global curve. Also, look at Fig. 6 in Jevrejeva et al. (2006) and Fig. 3b in Church et al. (2008)-- the rate of increase in SL has been increasing, although it seems with a distinct cyclical component. And I think it is obvious that a linear model would not fit the data presented in Fig. 3a in Church et al. (2008), and indeed they fit the data with a quadratic model. In fact, look at Fig. 1 in Jevrejeva et al. (2008) which shows the global SL from 1700 until 2000-- another quadratic model. So the data and publications show that John Cook is completely justified in saying that "So a broader view of the historical record reveals that sea level is not just rising. The rate of sea level rise has been increasing since the late 19th century" As for you choosing this statement "Sea-level rise is accelerating faster than the IPCC predicted". That is not even worth addressig becasue a) It is true (see The Copenhagen Diagnosis) and b) It is another strawman argumenat by you. Regarding point a), from the Copenhagen Diagnosis: "Sea level has risen faster than expected (Rahmstorf et al. 2007), see Figure 16. The average rate of rise for 1993-2008 as measured from satellite is 3.4 millimeters per year (Cazenave et al. 2008), while the IPCC Third Assessment Report (TAR) projected a best estimate of 1.9 millimeters per year for the same period. Actual rise has thus been 80% faster than projected by models." You also claim that "They are usually connected to alarming projections of even more acceleration in the future (yes, projections, whatever that's supposed to mean, never predictions), based on the alleged accelerating ice loss over Greenland" Are you serious or engaging in some odd form humour here? The contribution from dynamic ice loss is one of the unknowns that does not work in our favour. What about the loss from terrestrial glaciers, the WAIS and possibly even the EAIS? And what information do you have to support your insinuation that the ice loss from Greenland is not accelerating or to refute the findings of Jiang et al. (2010)? Also, feel free to argue with the findings presented by mspelto which indicate ice loss from the Greenland ice sheet has increased from about 60 km^3/yr in 1993/1999 to 80 km^3/yr in 1997-2003, to >100 km^3 in 2003-2007. Re GRACE, it is not cherry picking when it is the only data you have-- and the GRACE data have been placed in context. Are you going to accuse people of using the JASON data record or the RSS MSU data record of cherry-picking next? Thanks BP for making me waste my morning chasing down your misinformation and straw mean arguments.
    0 0
  12. One big problem for layman is that Goddard using data up to March 2010 if asked would have said in 12 months time the oceans will most likely be lower and John Cook would have said the oceans most likely will be higher. So, just as picking a longshot horse or stock doesn't make you an expert (you may just be lucky) people will pay attention to "winners" until their predictions are shown to be wrong.Jason1
    0 0

Prev  1  2  3  

You need to be logged in to post a comment. Login via the left margin or if you're new, register here.


The Consensus Project Website

THE ESCALATOR

(free to republish)


© Copyright 2024 John Cook
Home | Translations | About Us | Privacy | Contact Us