Climate Science Glossary

Term Lookup

Enter a term in the search box to find its definition.

Settings

Use the controls in the far right panel to increase or decrease the number of terms automatically displayed (or to completely turn that feature off).

Term Lookup

Settings


All IPCC definitions taken from Climate Change 2007: The Physical Science Basis. Working Group I Contribution to the Fourth Assessment Report of the Intergovernmental Panel on Climate Change, Annex I, Glossary, pp. 941-954. Cambridge University Press.

Home Arguments Software Resources Comments The Consensus Project Translations About Support

Bluesky Facebook LinkedIn Mastodon MeWe

Twitter YouTube RSS Posts RSS Comments Email Subscribe


Climate's changed before
It's the sun
It's not bad
There is no consensus
It's cooling
Models are unreliable
Temp record is unreliable
Animals and plants can adapt
It hasn't warmed since 1998
Antarctica is gaining ice
View All Arguments...


Username
Password
New? Register here
Forgot your password?

Latest Posts

Archives

Do critics of the hockey stick realise what they're arguing for?

Posted on 19 October 2010 by John Cook

The hockey stick, a reconstruction of temperature over the last 1000 or so years, is a much maligned graph. Critics of the hockey stick insist it underestimates past climate change. In particular, many insist that temperatures during the Medieval Warm Period were warmer than now. The next logical leap is that if past natural climate change is comparable to today, then current climate change must also also natural. The irony of this line of thinking is that if the Medieval Warm Period did turn out to be much warmer than currently thought, this doesn't prove that humans aren't causing global warming. On the contrary, it would mean the danger from man-made global warming is greater than expected.
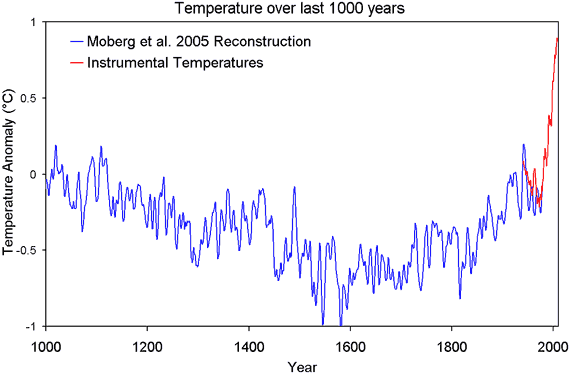

Figure 1: Northern hemisphere temperature reconstruction from Moberg et al 2005 plus instrumental measurements of northern hemisphere land temperature (CRUTemp).

To understand this, you first need to grasp the fact that climate doesn't change by magic. It changes when it's forced to change. When our planet suffers an energy imbalance (eg - the energy imbalance caused by rising CO2), it gains or loses heat. This change in heat is known as a radiative forcing or climate forcing. When our climate experiences a forcing, global temperature changes.

So to understand climate change over the last 1000 years, you need to look at the climate forcing over that time. The overall or net climate forcing is the combined effect of the drivers of climate over this time frame: mainly solar variations, changes in carbon dioxide, volcanic eruptions and aerosols:
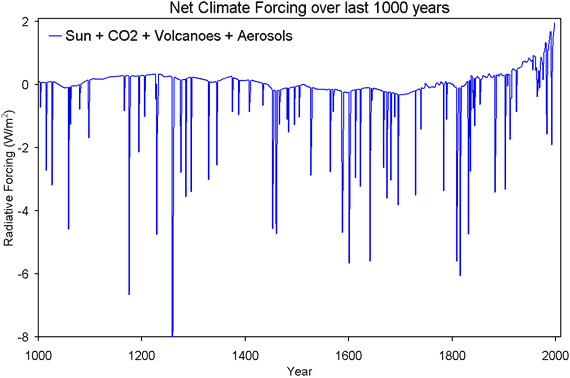
Figure 2: The combined radiative forcing from solar variations, CO2, volcanoes and aerosols (Crowley 2000).

The dramatic spikes are the strong negative forcing from volcanic eruptions. To gain some visual clarity, Figure 3 shows net climate forcing without volcanic eruptions. This gives us a good approximation of net climate forcing as volcanoes for the most part only affect climate for a few years before the sulfate aerosols from the eruption are washed out of the atmosphere.
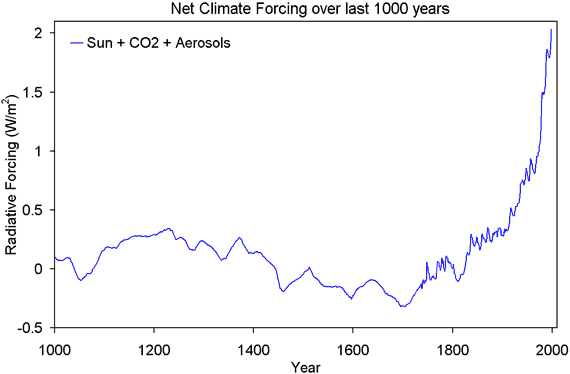
Figure 3: The combined radiative forcing from solar variations, CO2 and aerosols - volcanoes are omitted (Crowley 2000).

The reason we see a hockey stick shape in temperature is because the climate forcing that drives temperature also shows a hockey stick shape. But from this data, we can do a lot more than compare shapes. We can calculate how much global temperature should change when it's subjected to a climate forcing. This information is crucial in enabling us to predict how climate will act in future decades in response to rising greenhouse gases.

The temperature response to a climate forcing is known as climate sensitivity. Technically, climate sensitivity is defined as the change in global temperature if the planet experiences a climate forcing of 3.7 Watts/m2 (which is how much climate forcing you get from a doubling of CO2). The amount of positive feedback in our climate system determines how sensitive our climate is. If there's net negative feedback, the climate sensitivity will be less than 1.2°C. If climate sensitivity is greater than 1.2°C, our planet has net positive feedback. Climate sensitivity can be calculated by using temperature change over the past 750 years along with the change in radiative forcing (Hegerl et al 2006). Doing this yields the following result:
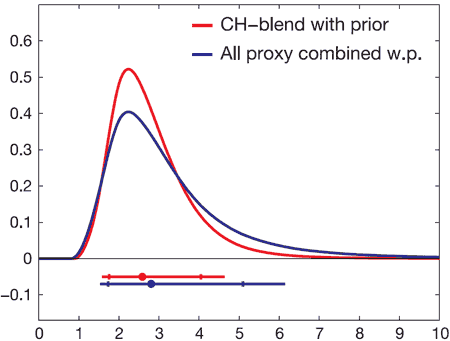

Figure 3: Climate sensitivity from palaeoreconstructions going back 750 years, combined with climate sensitivity calculated from instrumental records. The horizontal bars represent the 5 to 95% range, indicating a climate sensitivity range of 1.5C to 6.2C (Hegerl et al 2006).

When you combine the temperature record over the past millennium with climate forcings, you get a climate sensitivity around 3°C. In other words, net positive feedback. This is consistent with the IPCC climate sensitivity range of 2°C to 4.5°C. Positive feedback is the reason why we expect to see strong warming over the next century in response to the climate forcing from rising CO2.

Can you now see the irony in insisting on a warmer Medieval Warm Period? If for some reason, temperatures over the Medieval Warm Period turn out to be warmer than previously thought, this means climate sensitivity is actually greater than 3°C. The climate response to CO2 forcing will be even greater than expected. So to argue for a warmer Medieval Warm Period is to argue for greater climate sensitivity and greater future warming due to human CO2 emissions.

UPDATE 21 Oct 2010: I've corrected the labelling of Figure 1 from "instrumental temperature measurements of northern hemisphere (HadCRUT)" to "instrumental measurements of northern hemisphere land temperature (CRUTemp)" to clarify that the instrumental data is land temperature, not land and ocean (as the Moberg data is also land only).

0 0

Printable Version  |  Link to this page

Comments

Prev  1  2  3  

Comments 101 to 115 out of 115:

  1. @protestant: "The problem with positive feedbacks is that it would lead in to unending loop of warming." This is false, as explained in this article: Why positive feedback doesn't necessarily lead to runaway warming
    0 0
  2. JMurphy IPCC FAR 1990 P202 Fig 7c.
    0 0
  3. "Recent" according to Craig: H. H. LAMB, 1965, THE EARLY MEDIEVAL WARM EPOCH AND ITS SEQUEL Palaeogeography, Palaeoclimatology, Palaeoecology
    0 0
  4. I agree, doug_bostrom. There is more about this (and its appearance in Wegman's dodgy report, and The Great Global Warming Swindle(sic) - which is probably where so-called skeptics get it from) at Stoat, where you will also learn that the graph is for Central England only - not global. As it says at Stoat : So: just in case it isn't clear from the above: fig 7.1.c isn't useful anymore. It was vaguely useful then because there was nothing better available. It was a hurridly drawn sourceless schematic that no-one uses nowadays; and if anyone *did* use it they would be roundly criticised. You can also read about it here at Skeptical Science. Try again, please, craig.
    0 0
  5. The title of Lamb's paper is wholly ironic considering how it was deployed here. So, a laugh at least. :-)
    0 0
  6. #100: You asked for evidence for Cosmic Rays and climate correlation, there you go, a plot from Bond et al: http://img39.imageshack.us/img39/702/cosmicrays.jpg This graph was originally presented in Jaspers Kirkbys talk about his project. Here is the pdf: http://wattsupwiththat.files.wordpress.com/2009/07/kirkby_cern_slideshow09.pdf Another study: http://tinyurl.com/27l3a2c plus many others. And yes, CLOUD is an experiment on cosmic rays and cloud formation. And yes, it doesnt measure TSI. But as you might know, if there is lesser clouds on solar maximums due to cosmic rays, it means also more sunlight is being let in. #101. Again, the "rebuttal" doesnt address my argument. Surely, warming with positive feedbacks will stop at some point. But how can the system cool, without having a forcing which is STRONGER than co2+positive feedbacks? Decreasing CO2 cant be the cause of cooling since something had to cool the SST first. CO2 follows the temperature, not the otherway around. @moderators: Sorry for offtopic, but just had to answer some commenters who answered to mine. Since the main topic is sooo large it is sometimes hard to stand in just one small subtopic. Since everything is related to everything. At least at some point you should be able to debate the subject in a larger context?
    0 0
    Moderator Response: The idea of ocean warming being the cause of the observed trend in CO2 is discussed on the "Is the long-term trend in CO2 caused by warming of the oceans?" SkS blog post.
  7. Protestant, an example from the rebuttal: The dramatic spikes are the strong negative forcing from volcanic eruptions.
    0 0
  8. doug, but they explain only a fraction of the spikes. The rest remains unexplained and let me tell you we have no idea what caused them. And until we know we cannot tell we know the forcings of today, or even if climate actually needs a forcing to change. Anyway what we know is the temperatures always fell when CO2 was high and still rising for centuries.... The base tenet for CAGW is that no change occurs if no external forcing is presented. CAGW doesnt take into account the internal unforced variability in cloud cover, which may very well have caused the MWP, LIA and a part of the Modern maximum. Many CAGW-trumpetists claim strong MWP means a more sensitive climate which is simply untrue (as some true skeptics like Judith Curry argue, you REALLY should look at her blog and read the posts&discussions about climate models and sensitivity etc. She takes the uncertainities much better in to account than to the specific results overconfident SkS). If (and propably) it is caused by internal variability, then negative feedback to radiative forcing actually fits in the explanation. We already have evidence on 60 year cycles like PDO and AMO after all, which are caused by winds, which are caused by pressure changes in condensation (cloud formation, models ignore this). No reason not to believe that there are longer cycles aswell (as again, MWP points out). We also have the empirical evidence (Spencer 2007) that more water wapor means more tropospheric clouds (cooling effect) and less stratospheric ice clouds (warming effect). We also have evidence presented by Spencer 2008 and 2010 that longer scale sensitivity analysis leads to a noisy, biased result.
    0 0
  9. #106: "Kirkbys talk about his project. " Oh, that again. As I said earlier, 'it's cosmic rays ' just doesn't stand up to scrutiny. And of course, that's the more appropriate thread for such comments.
    0 0
  10. #106. Go tell that to Kirkby. The initial first run results are off and being published sometimes soon. Just wait and see. For example Kulmalas results are only calculations not empirical evidence. It is just so frustrating, that you are answering to every sentence and a paragraph with another link to another "rebuttal" which takes in to account only one side of the evidence while totally ignoring some very important scientific peer-reviewed results and not providing any evidence why they should be ignored. That is called cherry picking. Being skeptical doesnt mean you have to be only skeptical about the skeptics. You also have to be skeptic about your own opinions, otherwise it leads to confirmation bias. And this is the biggest problem here.
    0 0
  11. Ok, I promise to stop off-topic now. Continue....
    0 0
  12. #110: "you are answering to every sentence and a paragraph with another link to another "rebuttal" which takes in to account only one side of the evidence" Sorry that you feel frustrated by the references to other pages on SkS. Maybe its because the folks here have already reviewed, discussed, argued over, looked at both sides and come up with rebuttals for a lot of the tired old skepticisms. If you actually read the referenced argument page, you'll see both sides get reviewed (and that's neither cherry-picking a la Goddard nor confirmation bias a la Watts). As for Kulmala, see this comment and its quote from that article.
    0 0
    Moderator Response: One of the strengths of this Skeptical Science site is its division into narrow topics (notwithstanding the few exceptionally broad topics). By commenting on the appropriate thread, you not only avoid diluting other threads, you also dramatically increase the chance of people who are interested in your topic seeing your comment, because they will be looking on the appropriate thread, not the inappropriate threads. We encourage you to post short comments on the inappropriate threads on which conversations began, but only to link to your comments on the appropriate threads. You can get the HTML for the link target of your new, appropriately placed, comment by right-clicking on your new comment's date/time tag.
  13. @protestant: "Anyway what we know is the temperatures always fell when CO2 was high and still rising for centuries...." It didn't "always fall" - you identified a single instance of this. In any case, that question was already answered: in normal Milankovitch cycles, CO2 is a feedback mechanism - the main forcing is orbital variations, which then cause increased albedo and lower CO2 as temperatures go down. In the current situation, anthropogenic CO2 is acting as a forcing. "CO2 follows the temperature, not the otherway around." Actually, it's both. Look, it's clear your mind was already made up that AGW wasn't real when you came here. You tried to challenge the science, and when presented with evidence of how you're wrong, you start complaining about it. To people like me, who come here to learn, you're just another random Internet contrarian, repeating the same old debunked arguments.
    0 0
  14. Shoot this down if you want, but I think the sceptics obsession with the MWP proves that they are Lovelock/Hansen style "alarmists" (or would be if they thought about it...). The most "sceptical" of those credible scientists, quoted by the denialist element (Lindzen et al), reckon that their purported low climate sensitivity will lead to less than 1 degree C for a doubling of CO2, which would take us (globally)in due course outside the peak of the (probably) local MWP. Surely the most fervent deniers must accept that, if it was as fertile and lush and lacking in ice as they claim, then also surely the albedo of "fields of corn" Greenland and elsewhere, such as Northern Russia and Alaska etc would have been a lot lower. If they accept that a small amount of increase from the previous cooler era lead to a fertile darker surfaced Greenland etc then they must accept that ice sheets are very much more prone to radical melting and disappearance due to small temperature changes than hitherto suspected in which case they must realise that their beliefs must mean there is a very large positive feedback that melts ice quickly although they would also have to explain why the rise in the MWP was not much larger if the planetary albedo was so much less too. So, if they believe in the denialist/Singer version of the MWP, they must expect Greenland to melt rapidly leading to a greater albedo feedback that mainstream climate science does not expect for a long time. Deniers are alarmists!
    0 0
  15. Protestant, "We already have evidence on 60 year cycles like PDO and AMO after all, which are caused by winds, which are caused by pressure changes in condensation (cloud formation, models ignore this)" The AMO is not caused by this process at all. You should consider reading the literature prior to making grand statements that are vitally flawed. The AMO is a proxy for the strength of the thermohaline circulation (THC). Positive phases indicate a strengthening of the THC and negative phases indicate a weakening of the THC. It occurs over a roughly 70 to 80 year period and is directly linked to sea ice transport through the fram strait. I can give you a more direct explanation if you prefer? Another side note, Judith Curry may be well-known but I would rather get my information from other people than her. There's a reason she's taken such a beating at RC and elsewhere, it is because she is often wrong. Finally, I do agree with one thing you had to say, this post does insinuate that there is a clear forcing and effect. I believe that millennial scale climatic changes are inherent within the climatic system as found by Viau et al (2006) however I don't think they have a cloud origin. I would guess ocean driven with some sort of Solar initiation perhaps.
    0 0

Prev  1  2  3  

You need to be logged in to post a comment. Login via the left margin or if you're new, register here.


The Consensus Project Website

THE ESCALATOR

(free to republish)


© Copyright 2024 John Cook
Home | Translations | About Us | Privacy | Contact Us