Climate Science Glossary

Term Lookup

Enter a term in the search box to find its definition.

Settings

Use the controls in the far right panel to increase or decrease the number of terms automatically displayed (or to completely turn that feature off).

Term Lookup

Settings


All IPCC definitions taken from Climate Change 2007: The Physical Science Basis. Working Group I Contribution to the Fourth Assessment Report of the Intergovernmental Panel on Climate Change, Annex I, Glossary, pp. 941-954. Cambridge University Press.

Home Arguments Software Resources Comments The Consensus Project Translations About Support

Bluesky Facebook LinkedIn Mastodon MeWe

Twitter YouTube RSS Posts RSS Comments Email Subscribe


Climate's changed before
It's the sun
It's not bad
There is no consensus
It's cooling
Models are unreliable
Temp record is unreliable
Animals and plants can adapt
It hasn't warmed since 1998
Antarctica is gaining ice
View All Arguments...


Username
Password
New? Register here
Forgot your password?

Latest Posts

Archives

The many lines of evidence for global warming in a single graphic

Posted on 30 December 2010 by John Cook

I've added another pic to the high-rez Climate Graphics. This one is a graphic  summary of just some of the evidence for global warming. When someone tells you global warming isn't happening, this serves as a visual reminder that you need to consider all the evidence to understand what's happening to our climate. Signs of warming are being found not only all over the globe but in many different systems. Ice sheets are shrinking. Tree-lines are shifting towards the poles and up mountains (eg - to cooler regions). Glaciers are retreating. Spring is coming earlier. Species are migrating to cooler regions. And so on...
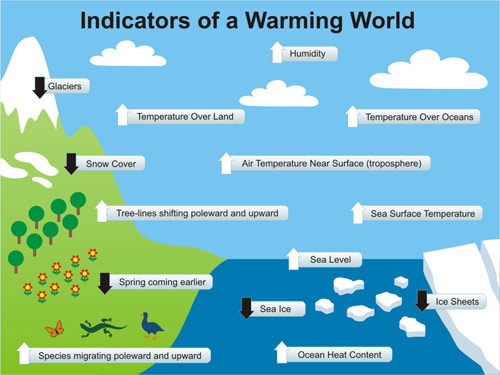
This pic is adapted from The Guide to Global Warming Skepticism, stretched to 1024 x 768 pixels for powerpoint presentations. The attentive reader may have noticed it bears more than a passing resemblance to a pic from the NOAA State of the Climate Report. Yes, I borrowed the concept from them but hey, in the NOAA Report (page 4), they borrowed my graphic on where global warming is going so we're even! :-)

However, I did think the NOAA graphic could use some fleshing out. There is a fantastic paper A globally coherent fingerprint of climate change impacts across natural systems (Parmesan & Yohe 2003). This paper looks at changes in a whole range of systems, including more than 1700 species. What they find is the distribution of plants and animals are shifting towards the poles around 6 kilometres per decade. Spring events are advancing just over 2 days per decade. Animals are also mating earlier and I'm fairly sure this is because of warming, not because they're getting randier.

There are a number of other indicators of warming that I considered including in the graphic. For example, lake and river ice cover are freezing later and breaking up earlier (Magnuson 2000, Hodgkins 2005, which would've made a good visual inclusion. Arctic permafrost is warming at greater depths (Walsh 2009) but how do you depict that? Lakes are warming (Schneider & Hook 2010) and the growing season is lengthening (Christidis 2007). But there was only so much room to fit in the graphic before it gets too crowded. Maybe I'll do a poster version one day.

As with all our Climate Graphics, this one is under a Creative Commons license so you're welcome to reuse it. It's available in a number of formats:

0 0

Printable Version  |  Link to this page

Comments

Prev  1  2  

Comments 51 to 65 out of 65:

  1. Why should there have been an optimum decade?
    0 0
  2. #47 michael sweet I looked through all the monthly anomalies for snow cover. It does appear that in May, June and July snow cover has dropped in the Northern Hemisphere since 1988 but not the other months. The 12 month running mean shows no decrease in snow cover from 1988 to 2010. The graphic indicates only snow cover has decreassed. It does not make the specification that summer snow has decreased so the arrow is still not valid. Snow cover has not gone down in NH in any meaningful trend since 1988 (22 years), it should be horizontal. In your Tamio graph of summer snow cover, what would your red trend line look like if you started at 1988 instead of 1967? Would it still be going down? Or would it be a flat-line?
    0 0
  3. Bibliovermis (51): the Optimal Decade gambit is clearly a straw-man, logic-fail argument.
    0 0
  4. in science when you report an increase or a decrease, you would normally be required to state 'from when', at least in my experience ?
    0 0
  5. Norman why cherry-pick 1988? What is so special about that particular year, are we missing something? Why not look at all the data? Well, a quick inspection of the data betrays your intent. Anyhow, N. Hemi. snow cover in the warm season is decreasing, stop trying to claim otherwise by eye-balling and cherry-picking. It didn't work with SATs and 1998, and it is not going to work now. PS: Actually, I bet that if you cherry pick 1988, a quadratic will give you the best fit (vs linear), with an inflection point around 1996.
    0 0
  6. Billj, That information is readily available. Newcomers, start here What is the basis for presuming there was an optimum decade?
    0 0
  7. Baseline for changes is readily accepted in other scientific disciplines.I would have thought that a simple annotation to the graphic would make the point of this post really clear.I'm surprised by the lack of this data here and the rather childish response of 'go look for it somewhere else'.
    0 0
  8. Billj, The graph is a schematic. With that said, the baseline typically used for global SATs is 1951-1980--of course the window used does not affect the long-term trend. My take of these data is that they obviously are intended to reflect the warming that has been observed during the instrumented record, say circa 1850 (HadCRUT) or 1880 GISTEMP.
    0 0
  9. Given that the 'skeptics' are too lazy to actually back up their assertions with some numbers and to crunch some numbers, I have done it for you. Mean N.Hemi snow cover extent (SCE; data from Rutgers) for March-May (Boreal Spring) is not explained by a simple linear model (the fit is not statistically significant, with R^2 =0.01). The cherry-picked data are, as predicted, explained pretty well (R^2 = 0.345) by a quadratic function, with an inflection point in 1998. So, "skeptics", please allow us then to pick 1998 as the start point for a rapid decline in N. Hemi. SCE? ;)
    0 0
  10. Norman, The Northern Hemisphere snow cover in summer has declined so far that there is little room left for decline. The snow is essentially all gone. I conceed that you are correct that in 1988 there was almost no snow and that the current years are not significantly lower (since it is impossible to go lower than zero). I will also conceed that there is no longer retreat in those glaciers that have completely melted. I do not think that the disappearance of the snow cover in summer means it is not getting warmer. Argue however you want. The data is clear.
    0 0
  11. @TÖP #49 At most AGW and GW are different "agendas" to people who only have a life with those. AGW is GW with an specific cause. You know it and you also know you were playing with the ambiguity in your words. Just in case you "won't understand", this is an analytical site that has developed a number of different argumentative lines not only for the sake of analysis but also as a way to neutralize the insidious tactic of the self called global-warming-skepticism, that of "throw(ing) everything at the wall a see what sticks". Following that lines this post offers a depiction including some GW evidence. You simply tried to make the causes of it the argument -a complete offtopic-. You later included Hansen in your plea, what dispels any doubt one can have, methinks.
    0 0
  12. Strangely (as an AGW sceptic) I agree that it is the science that divides us on AGW. Firstly the raw temperature data from around the planet does not support the claim that there is ANY warming going on. Only after NASA or the UEA have "ahem" adjusted the data does warming appear. Secondly even if there WAS a consensus on the scientific basis for AGW (which I do not agree exists) it would be irelevant. The science suggesting that man is warming the planet and that this is happening through increasing Greenhouse gases is theory, it is not tested/proven experimentally/empirically. Fortunately the planet has actually done the xperiments for us so we do not need to worry about the current theories until they agree with the empirical evidence.
    0 0
  13. Re: Dung (62) OK, let's do something differently: Debunking back to front this time!
    "The science suggesting that man is warming the planet and that this is happening through increasing Greenhouse gases is theory, it is not tested/proven experimentally/empirically."
    Wrong. Science has known about the GHG properties of CO2 for over 150 years, in theory, experimentally and empirically. That the planet is warming is accepted fact. That man is the cause of it is over 90% certain (google the National Academy of Sciences position statement on this).
    "Secondly even if there WAS a consensus on the scientific basis for AGW (which I do not agree exists) it would be irelevant."
    Wrong again. All right, I'll help ya out. That consensus statement can be found here.
    "Firstly the raw temperature data from around the planet does not support the claim that there is ANY warming going on. Only after NASA or the UEA have "ahem" adjusted the data does warming appear."
    Strike Three. See, actual scientists use temperature anomalies (deviations from established norms) so they can actually find out the answers to questions like that. There's no mystical mumbo-jumbo going on. anyone with a modicum of computer skills can google the wiki page on temperature datasets and adjustments & find that out for themselves. Or you can just look at the summary of all of them here: (using the 133-month average filters out the noise effects of the solar cycle, revealing the signal in the data) Either the sky in your world is a different color or you've been feed a long line of hoo-hah. But don't take my word on it. Everything you need to find out the truth for yourself on things climate-related you have available with a few mouseclicks. The only remaining question is this: 1. Are you really interested in thinking for yourself? or 2. Are you content to have others do your thinking for you? If the answer is Yes to number one, a good start can be had by going here first and then here. Your call. The Yooper
    0 0
  14. #62: "Fortunately the planet has actually done the xperiments for us so we do not need to worry about the current theories until they agree with the empirical evidence." Yooper, You missed that last bit. What does it mean? Could he be referring to this experiment? Or maybe this? Happy New Year!
    0 0
  15. Re: muoncounter (64) More like this. The Yooper
    0 0

Prev  1  2  

You need to be logged in to post a comment. Login via the left margin or if you're new, register here.


The Consensus Project Website

THE ESCALATOR

(free to republish)


© Copyright 2024 John Cook
Home | Translations | About Us | Privacy | Contact Us