Ocean heat flux and the Arctic
Posted on 3 July 2012 by Neven
This is a re-post from Neven's Arctic Sea Ice blog. Larger versions of the images in this post are available there.
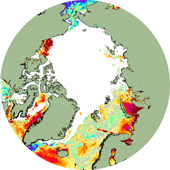 There are many factors involved in the current long-term decline of Arctic sea ice. From relatively small ones like river discharge, precipitation and soot, to bigger factors like atmospheric patterns and air temperatures. The possibly biggest factor of all is also the factor that is the most unknown and uncertain: ocean heat flux. How much heat are ocean currents bringing into the Arctic?
To quote the first paragraph of this 2011 article by Ron Kwok and Norbert Untersteiner: "The surplus heat needed to explain the loss of Arctic sea ice during the past few decades is on the order of 1 W/m2. Observing, attributing, and predicting such a small amount of energy remain daunting problems."
Ocean heat flux is what separates the aggressive and famous forecast by Wieslaw Maslowski (Arctic essentially ice-free by September 2016, ± 3 years) from more conservative estimates that predict the thing to happen between 2050 and the end of this century. As explained in this BBC article from 2007:
[...] the Monterey researcher believes these models have seriously underestimated some key melting processes. In particular, Professor Maslowski is adamant that models need to incorporate more realistic representations of the way warm water is moving into the Arctic basin from the Pacific and Atlantic oceans.
"My claim is that the global climate models underestimate the amount of heat delivered to the sea ice by oceanic advection," Professor Maslowski said. "The reason is that their low spatial resolution actually limits them from seeing important detailed factors.
"We use a high-resolution regional model for the Arctic Ocean and sea ice forced with realistic atmospheric data. This way, we get much more realistic forcing, from above by the atmosphere and from the bottom by the ocean."
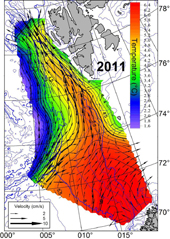 What makes ocean heat flux so complex is that it's very difficult to measure the amount of water and heat brought into the Arctic by the warm West Spitsbergen Current and through the Bering Strait, let alone year-to-year variability (source image on the right). Ocean currents are determined by the Coriolis effect, the shape of the ocean floor and vertical mixing of different layers in the water column that all have different temperatures and levels of salinity. To quote again from the Kwok & Untersteiner article:
The heat carried into the Arctic Basin by the West Spitsbergen Current and the Bering Strait inflow has been documented by oceanographic moorings. But the mixing of those flows inside the Arctic Basin and the processes by which the imported warm water gives up
its heat to the ice remain a subject of research.
The only certainty is that a small change in ocean heat flux
can have a large effect in ice thickness.
Given the complexity of the subject I was very happy to find an excellent research overview published last year in the science magazine Oceanography and written by leading experts on the subject, such as Agnieszka Beszczynska-Möller and Rebecca A. Woodgate:
A Synthesis of Exchanges Through the Main Oceanic Gateways to the Arctic Ocean. Here's a quote from the introduction:
A large-scale shift to warmer conditions in the Arctic has been observed since the early 1990s, including warmer Atlantic inflow (Holliday et al., 2008; Schauer et al., 2008); sporadic warming of the Pacific Water inflow, especially in 2007 (Woodgate et al., 2010); intrusions of anomalously warm water over Arctic shelves (Dmitrenko et al., 2010), along the Arctic continental margin (Dmitrenko et al., 2008), into the central Arctic (Polyakov et al., 2005), and in the Canada Basin (McLaughlin et al., 2009); and a large increase of ocean-atmosphere heat fluxes due to sea ice losses (Kurtz et al., 2011). In addition, heat carried by Pacific inflow through Bering Strait appears to play an important, triggering role in recent sea ice decline in the western Arctic (Woodgate et al., 2010).
The rest of this post will be about this research paper (PDF). You can read the synthesis if you'd like more details and references, as I'll only be summarizing the summary here. Ocean flux is mostly about volume and heat, measured in sverdrups and (tera)watts respectively. Most people know what a terawatt is (a lot of hair dryers, Wikipedia has a few examples of TW magnitude). The sverdrup is a unit of measure of volume transport, with 1 Sv corresponding to a water flow of 1 million cubic meter (1 billion liters) per second. The entire global input of fresh water from rivers to the ocean is equal to about 1 Sv.
The first thing that struck me when reading the paper's
introduction is that  so far a lot of efforts have been made already to get an idea of what is going on with ocean heat flux towards and in the Arctic. From the RUSALCA program to the IPY effort, the VEINS project, the international pan-Arctic
ASOF study and subsequent DAMOCLES project, the NSF Freshwater Initiative, and CATS. It's been a while since I saw so many acronyms in just one paragraph. Climate science is often portrayed as being done by just a handful of incredibly mighty and science corrupting scientists, but it's good every now and then to realize that these acronyms represent literally thousands of scientists, busy every day with the painstaking tasks of taking, interpreting and processing measurements.
In this case in one of the harshest environments of the planet,
for decades, centuries even. Really, it's not just Michael Mann
and Phil Jones sitting in a dinghy last summer throwing buckets
into the water to measure temperatures (which will be fudged
later anyways, right). But I digress...
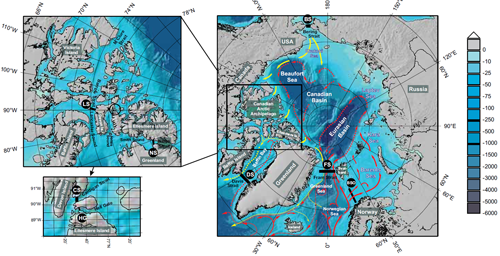
The Beszczynska-Möller et al. paper gives extensive info on the main Arctic oceanic gateways: the Barents Sea Opening (BSO), Fram Strait (FS), Bering Strait (BS), the Canadian Polar Shelf and Davis Strait (DS). The figure below from the paper shows the gateways and the locations of moored arrays to measure volume and heat flux, with Lancaster Sound (LS), Nares Strait (NS), Cardigan Strait (CS) and Hell Gate (HG) in the left panels:
We start with the Barents Sea, which of course is of interest because of the cutting-edge research with regards to the influence of warm waters in that region on weather patterns during winter (see WACC overview). The Norwegian Atlantic Current (NwAC), a branch of the North Atlantic Current (itself a continuation of the warm Gulf Stream), splits up into a western and eastern part. The western branch rejoins the West Spitsbergen Current (WSC) further up north, whereas the eastern branch, known as the Norwegian Atlantic Slope Current (NwASC), follows the Norwegian coast, and transitions into the North Cape Current as it passes the Barents Sea Opening (BSO), a 400 km wide passage between Bear Island (Bjørnøya) and the North Cape (see this map from Arctic.io). This is the main source of Atlantic Water (AW) to the Barents Sea, 1.8 to 2 Sv with large interannual variations. It is accompanied by the Norwegian Coastal Current (NCC) which brings in aprroximately 2.6 Sv of water from the Baltic Sea, the North Sea and Norwegian fjords and rivers, that is colder and less salty than AW, but warmer than the Arctic waters. After passing through the BSO a fraction of the inflow from the NwASC recirculates along a short pathway and exits through the BSO again. This is a lot of info, but the images below give an idea of how it works (found here and here).
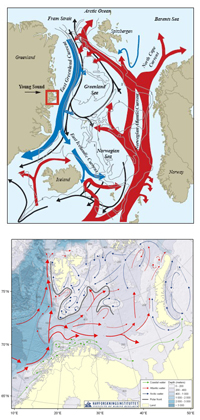 This warm Atlantic Water keeps large parts of the Barents Sea from freezing over during winter. This also means that almost all the heat, 67 of 73 TW delivered (Smedsrud et al. 2010), is lost to the atmosphere, and most of the AW leaving the Barents Sea into the Arctic Ocean via St. Anna Trough, east of Franz Josef Land, is already cooled to temperatures below 0°C. In 2010 a positive trend was reported in the temperature of the relatively stable NwASC volume flux, corresponding to a linear increase of 0.5°C in 1992–2009, whereas in the Barents Sea Opening, a temperature increase of 1°C over the period 1997–2006 (to values above 6°C) was reported. A modeling data assimilation study provided estimates of BSO inflow of 3.2 Sv, recirculation in the northern BSO of 1.5 Sv, and the outflows between Novaya Zemlya and Franz Jozef Land and through the Kara Strait of 1.1 and 0.7 Sv, respectively, similar to available observations.
In Fram Strait we see both an inflow of Atlantic Water through the West Spitsbergen Current, and an outflow of polar waters and sea ice out of the Arctic Ocean. Because the 440 km wide Strait is so much deeper than the relatively shallow Barents Sea (2600 m vs 260 m sill depth), the AW flowing into the Arctic is spread over deeper layers and thus retains its heat instead of releasing most of it to the atmosphere. The WSC splits into three branches. The easternmost, Svalbard branch constitutes the main source of AW to the Arctic Ocean. The Yermak Plateau branch circumvents the northwestern rim of the Yermak Plateau and ultimately rejoins the Svalbard Branch, thus also entering the Arctic. The westernmost branch of the WSC mostly carries waters from the western branch of the Norwegian Atlantic Current mentioned earlier, recirculates directly in the northern Fram Strait, and exits again to the south.
 The flow of AW through Fram Strait has been extensively studied since the early 1900's, but since 1997 a German-Norwegian array of 16 moorings has been monitoring volume and heat flux at different layers. To quote the paper:
Significant AW warming has been observed at the moored array in Fram Strait since year-round measurements began. Schauer et al. (2008) report distinctive temperature increases in two periods (1998–2000 and 2003–2006), with a net increase over the last decade of 1°C. Using a stream-tube approach to estimate the oceanic heat flux through Fram Strait, Schauer and Beszczynska-Möller (2009) obtained a mean value of 36 ± 6 TW for the 1997–2009 period. In recent years, substantial warming was also observed in the AW recirculating directly in Fram Strait.
At the same time water and sea ice is exported out of the Arctic waters through Fram Strait via the East Greenland Current (EGC), making up about half of all the freshwater export (Serreze et al. 2006). There are three different freshwater sources for the EGC: Pacific water, river runoff, and sea-ice meltwater. The sea ice melts in the Nordic Seas and North Atlantic,
whereas the East Greenland Current rounds the southern tip of Greenland
and becomes the West Greenland Current (WGC).
The Bering Strait differs greatly from the broad Atlantic gateways in that it's only about 50 m deep and 85 km wide. Year-round moorings have been deployed in the Bering Strait almost continuously since 1990. Although it only amounts to a long-term yearly average of 0.8 Sv the Bering Strait throughflow is a large oceanic source of nutrients for the Arctic and brings in one-third of the freshwater entering the Arctic Ocean. Because it's fresher the top layer of water shields the sea ice from the warmer, saltier layers below during winter. But in summer Pacific waters carry significant amounts of heat into the Arctic, and although highly variable from year to year, the heat flux (relative to the freezing temperature of seawater) is enough to melt 1–2 million km2 of 1 m thick ice (Woodgate et al., 2010). One of the reasons that made 2007 such a spectacular melt year was the fact that the Bering Strait oceanic heat flux was over twice that in 2001.
The other half of freshwater export out of the Arctic (besides the East Greenland Current) is done through the straits and channels of the Canadian Polar Shelf, more or less corresponding with what we know as the Canadian Archipelago. The most important gateways are Nares Strait, Lancaster Sound, and Cardigan Strait plus Hell Gate (see figure above). These gateways resemble Fram Strait in miniature, with similarly complicated recirculation and mixing, and flows simultaneously going in both directions at different depths, due to winds and tides that have a marked effect because of the geomorphic characteristics of the area. The extremely harsh environment - heavy sea and fast ice, icebergs, strong currents and interference from the shifting magnetic pole - makes it difficult to get accurate measurements of Canadian Arctic Throughflow (CAT). But that doesn't mean people don't try.
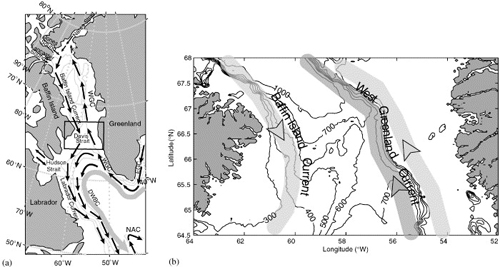
The water that goes through the Canadian Archipelago eventually ends up in Baffin Bay where the Baffin Island Current takes it through the 360 km wide and 650 m deep Davis Strait (see image above from Cuny et al. 2005). Meanwhile at the east of the strait cold water from the West Greenland Current, as well as warm, salty from the West Greenland Slope Current of North Atlantic origin, go north to mix with the waters from the Canadian Archipelago and flow out again in the western Davis Strait. Here as well it is difficult to make accurate flux estimates because of the width of the strait and the general harshness of the area, which for instance feeds Iceberg Alley. From the paper:
Recent studies (e.g., Holland et al., 2008) show that northward penetration of warm Atlantic waters along the Greenland coast may accelerate the motion of outlet glaciers by melting and breakup of the floating tongues that resist seaward motion. Increased northward heat transport through Davis Strait could thus accelerate Greenland ice cap melting, driving sea level rise and injecting additional freshwater into sensitive regions of the subpolar North Atlantic.
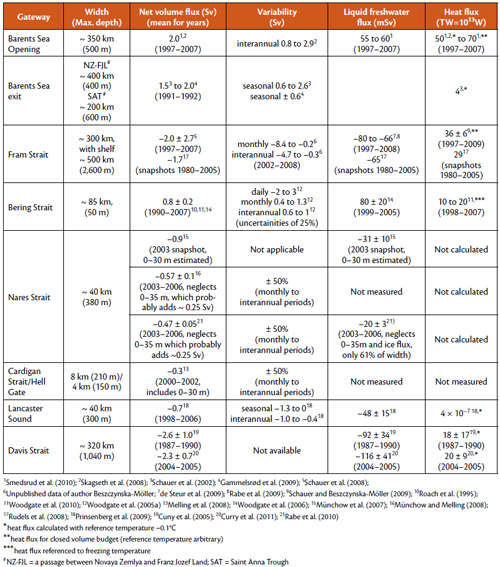
Below a figure from the paper showing all the estimated volume and heat fluxes through the oceanic gateways of the Arctic:
---
This is an incredibly educative and informative research paper. Not only does it give an excellent view on the names and pathways of oceanic currents, it also makes one realize the three-dimensional nature of oceanic currents that consist of different layers of different temperatures and salinity. Having exceeded comfortable reading length halfway through this blog post (for those having come this far: thank you for bearing), I decided not to summarize the part about new measurement technologies, numerical simulations and an excellent conclusion summarizing the uncertainties, difficulties and future challenges of measuring these oceanic fluxes.
There is still a lot of uncertainty surrounding ocean heat flux towards the Arctic and the subsequent effect on sea ice decline, although there are some indications that there has been an increase in heat transport towards the Arctic, particularly through the Atlantic gateways, but also at times through Bering Strait. Have a look at this image, showing the build-up of the Earth's total heat content (from Church et al. 2011):
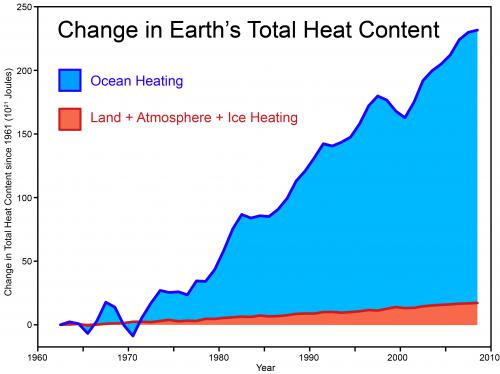
I don't think it's impossible for (part of) that 1 W/m2 to have come from there.
Or to echo professor Jennifer Francis: How can it not?


 Arguments


 0
0  0
0


Comments