Hurricane Sandy: Neither weather nor tide nor sea level can be legislated
Posted on 29 October 2012 by Doug Bostrom
Many Skeptical Science readers are following the progress of Hurricane Sandy as it continues on a collision course with the US eastern seaboard as well as an Arctic airmass. All of us hope for the best possible outcome for affected populations but at this point everything we know points to Sandy exacting a serious toll.
Meteorologist Dr. Jeff Masters has described some of the possible economic and financial impacts of Sandy, while University of Washington meteorology researcher Dr. Cliff Mass has explored how models are being employed to predict and narrow the landfall zone of Sandy.
Hurricane Sandy's arrival will be accompanied by a significant storm surge. This is unfortunately coincident with spring tides already bringing high water some 20% above normal, meaning that Sandy is expected to cause record coastal flooding. In a later post on his blog Dr. Masters describes the problem:
Last night's 9:30 pm EDT H*Wind analysis from NOAA's Hurricane Research Division put the destructive potential of Sandy's winds at a modest 2.6 on a scale of 0 to 6. However, the destructive potential of the storm surge was exceptionally high: 5.7 on a scale of 0 to 6. This is a higher destructive potential than any hurricane observed between 1969 - 2005, including Category 5 storms like Katrina, Rita, Wilma, Camille, and Andrew. The previous highest destructive potential for storm surge was 5.6 on a scale of 0 to 6, set during Hurricane Isabel of 2003. Sandy is now forecast to bring a near-record storm surge of 6 - 11 feet to Northern New Jersey and Long Island Sound, including the New York City Harbor. While Sandy's storm surge will be nowhere near as destructive as Katrina's, the storm surge does have the potential to cause many billions of dollars in damage if it hits near high tide at 9 pm EDT on Monday.
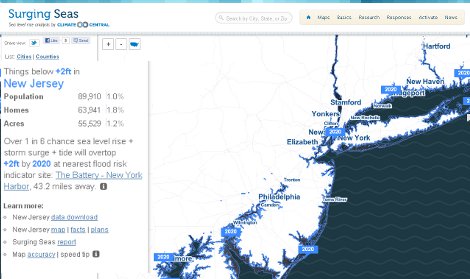
Climate Central provides a fascinating GIS tool called Surging Seas allowing users to explore effects of combined storm surge, tide and sea level rise on population and housing along the US coast. Early years of predictive output of this tool are dominated by "natural variability" in the form of storm surge and tides, with sea level rise (SLR) increasingly contributing as decades pass. Current storm surge predictions for New Jersey are in the range of 3 to 8 feet. Here's what Surging Seas shows us will happen with similar levels of flooding:

It's worth noting Surging Seas' presentation: this is all about probabilities, the odds of something happening in a given range of time. In the capture above we see there's approximately a 15% chance New Jersey will experience a 4' surge by the year 2020. As years pass, probability of a given surge level being achieved increases, due to sea level rise.
When tinkering and thinking with Surging Seas, something easily overlooked becomes more obvious. A few inches or a foot or so of sea level change doesn't go away when a combination of storm and tide pushes water onshore. These things are additive. There's a profound difference between having a dry home or business and one with 'just' a foot of water inside the first floor.
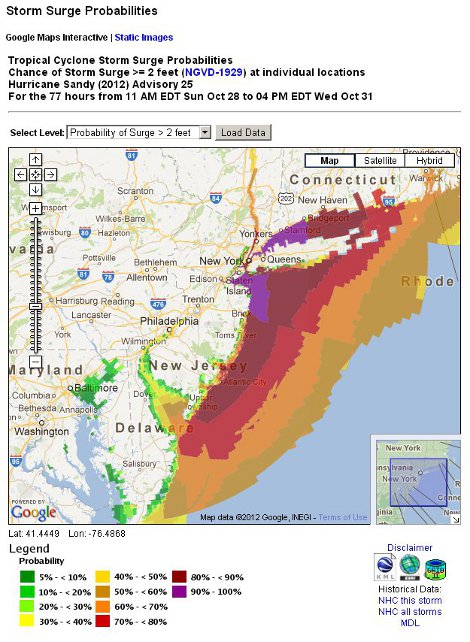
The US National Oceanic and Atmospheric Administration (NOAA) is providing an excellent interactive visualization tool for Hurricane Sandy's storm surge impact, updated as data comes in. Here's recent output:

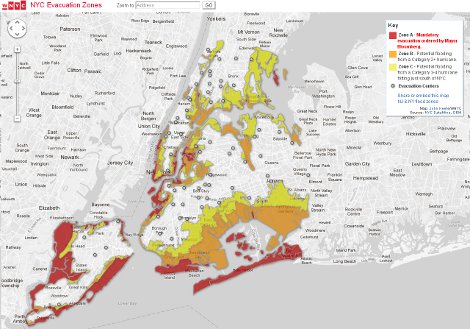
Beyond producing impressive graphics, reams of predictive data describing destructive effects of weather, tide and sea level rise end up affecting lives of actual people. After decades of operations unaffected by weather on the surface, New York City will be shutting down its subway system for the second time in only eleven months, Sandy being the second hurricane after last year's Irene to affect operations. Some 370,000 persons have been ordered evacuated from their homes by Mayor Bloomberg. Evacuation maps describe the scene:

After Hurricane Sandy has passed and people whose lives are altered by the storm begin picking up the pieces it's important that we remember to learn from this event, to salvage some value from what otherwise is pointless waste.
As Climate Central's GIS tool shows, regardless of sea level rise the long term odds for safety of coastal development are poor. Add in expected sea level rise and these odds become still worse; as years pass the probability of record high storm surges increases and the trend of storm surge heights is upwards. For homeowners and businesses in low-lying coastal locations this is like playing a dire game with the odds of winning steadily diminishing over time.
Recently in the news and discussed at Skeptical Science was the effort by North Carolina legislators to set boundaries on what information could inform public policy concerning coastal development. Virginia has been tempted to go down the same path. Sandy's arrival reminds us of the folly of trying to legislate facts not amenable to or concerned with matters of law. Lawmakers can deny funding and facilities to scientists researching effects of climate change and they can forbid planners from incorporating cold facts into policy. Unfortunately the jurisdiction of legislators does not extend to physics or weather or the phases of the Moon, as we're seeing.
Here are sincere good wishes from Skeptical Science for the health and safety of those confronting Hurricane Sandy. We wish you well.
Addendum: Jeff Masters provides updated analysis of Sandy's surge threat here.


 Arguments


A distant followup to this post. Here's a fine article in the New York Times describing how the New York City subway system was largely preserved during Sandy's passage and discussing future scenarios.
Could New York City Subways Survive Another Hurricane?
If you're not a NYT subscriber you can still read a limited number of articles per month. This article is worth the expenditure of a token.