Why did sea level fall in 2010?
What the science says...
| Select a level... |
 Basic
Basic
|
 Intermediate
| |||
|
Sea level fluctuations during El Niño (rising) and La Niña (falling) are the result of large exchanges of water between land and ocean in the form of rain and snow. This averages out to zero over time. It does not affect long-term sea level rise, which comes from melting icesheets, glaciers, and thermal expansion. |
|||||
Climate Myth...
Sea level fell in 2010
Large sea level fall in 2010 means IPCC sea level projections are wrong.
The last 18 months has seen some epic deluges throughout the world, countries such as Pakistan, Sri Lanka, Australia, the Philippines, Brazil, Colombia and the United States have been hammered with extreme flooding. It will take some time for studies about these episodes to appear in the scientific literature, so how the recent spate of massive floods stack up in a historical context is as yet unknown.
A recent news release over at the NASA Jet Propulsion Lab, which was re-posted here at SkS, helps in putting the extreme flooding into perspective - so much rain and snow has fallen over land in the period from March 2010-March 2011 that it has contributed to a large fall in global sea level. But this is only a temporary effect, as water is swapped back-and-forth between the continents and ocean, and does not alter the long-term rise in sea level which results from warming oceans and the melting of the polar icesheets and glaciers worldwide.
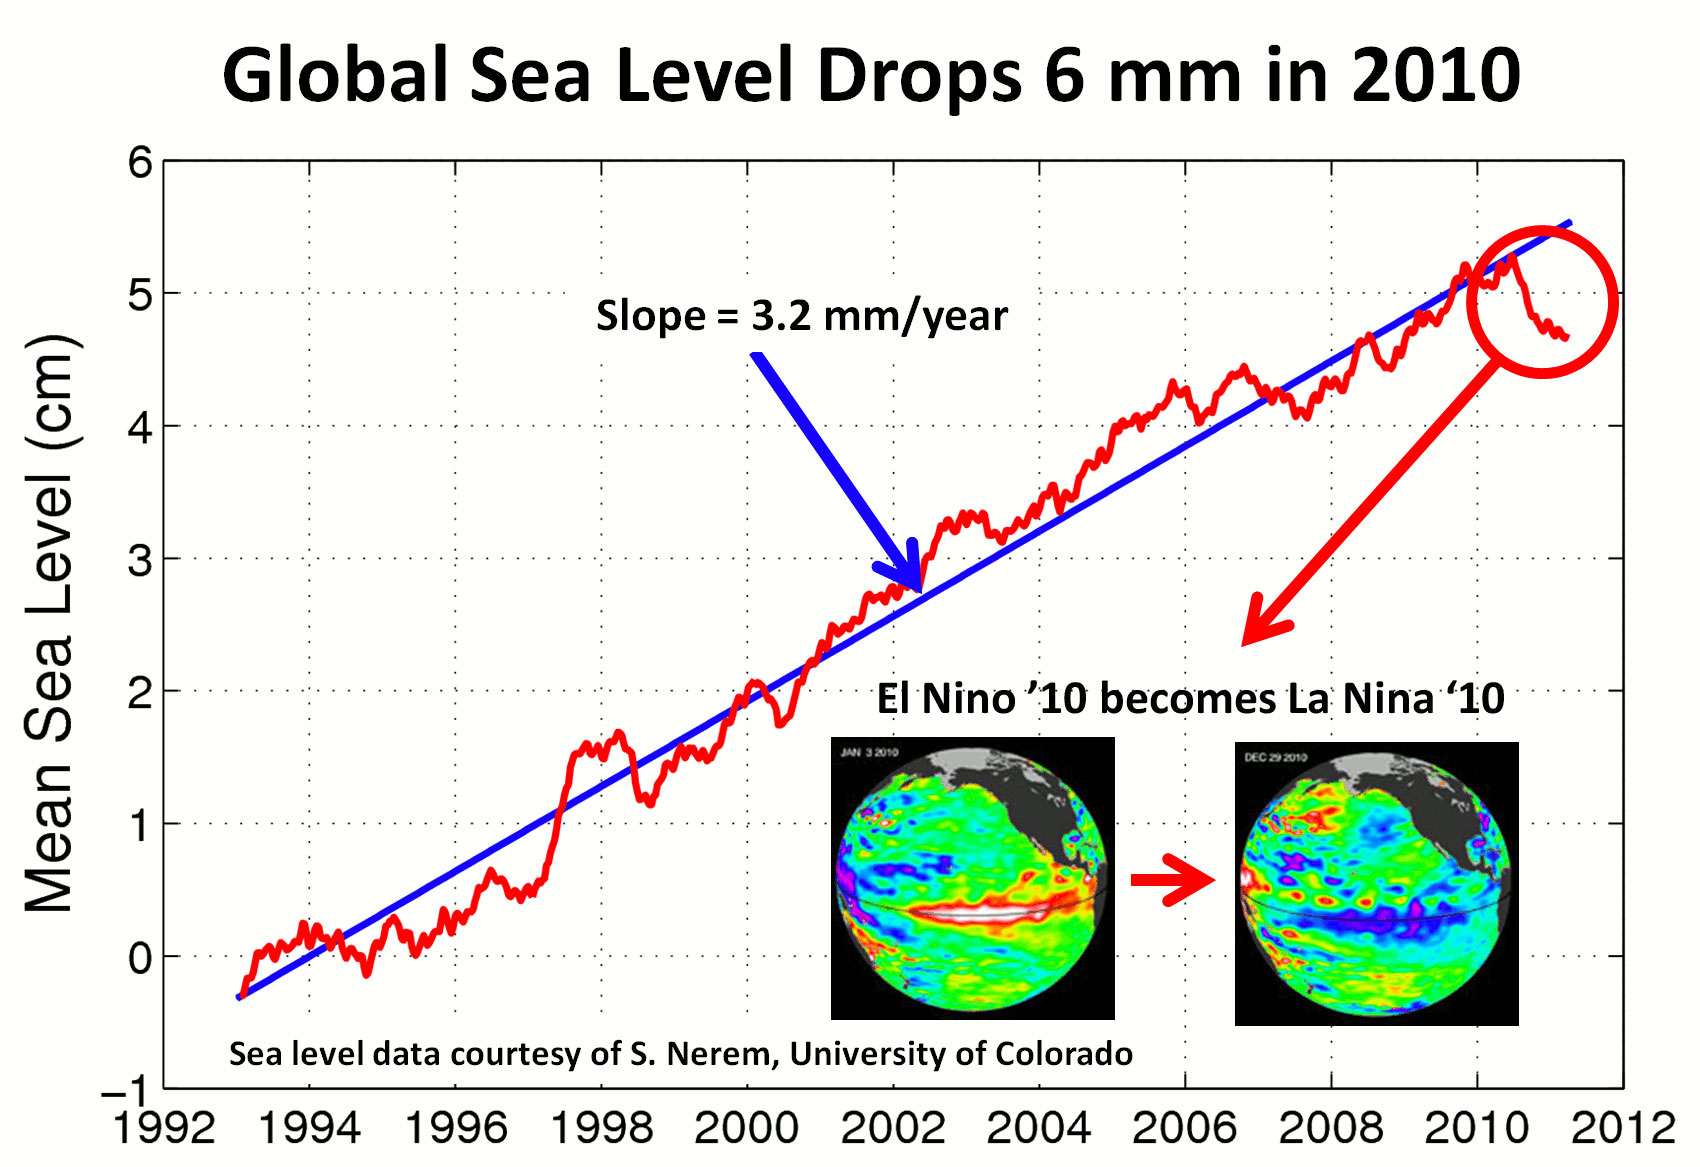
Figure 1 - sea level rise 1993-2011 from satellite altimetry. Image from NASA JPL
Short-term sea level fluctuations
Perhaps a poorly understood process, on climate blogs, is the large exchange of water between the ocean and land over short timescales (months/years), which is illustrated in the NASA JPL article. Tremendous volumes of water are evaporated from the world's oceans, and as the holding capacity of the atmosphere is small compared to the land and ocean, this evaporated water ultimately ends up back in the ocean, or on land in the form of either water, snow or ice.
Each year there are seasonal fluctuations in global sea level which are caused by water swapping back and forth between the land, atmosphere and ocean, and asymmetric (unbalanced) heating of both hemispheres. Because most of the world's land mass is in the Northern Hemisphere, a large amount of water is stored there in the winter in the form of ice, snow and water, and this results in an increase in land-based water storage. At the same time, the Southern Hemisphere is angled closer to the sun, and because it is mainly ocean, the sun heats a huge pool of water, creating a rise in sea level through thermal expansion. The end result of these two out-of-sync processes is the variation shown below, and which results in seasonal sea level fluctuations of 6-9mms.
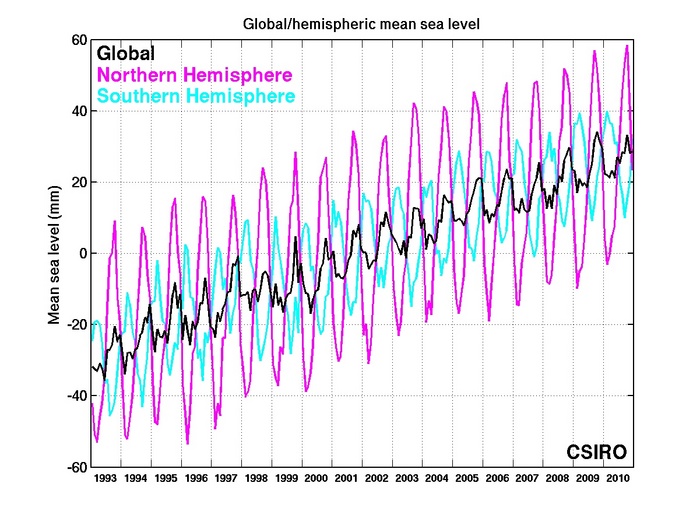
Figure 2 -Global and hemispheric-mean sea level from TOPEX/Poseidon and Jason-1. The two hemispheric signals partially cancel to produce a global signal with smaller amplitude. From www.cmar.csiro.au
The peak contribution of water mass to the global oceans generally occurs in September at the end of Northern Hemisphere summer as water, stored in snowpack, soils, lakes, rivers, soils and vegetation, is fed back into the sea. And the peak thermal component (ocean expansion from warming) occurs in April, at the end of the Southern Hemisphere summer - when the large expanse of Southern Ocean is exposed to greater solar heating. The annual global sea level peak matches the Northern Hemisphere run-off of water back into the oceans, which is the stronger of the two signals on a year-to-year basis. See Willis (2008) and Leuliette & Willis (2011) for an overview.
You will note the difference with figure 1, which has had the 'seasonal signal' removed to show the long-term trend. It should be obvious from both figure 1 & 2, that despite the large short-term fluctuations, these fluctuations are only temporary. Global sea levels continue to rise as the oceans warm and expand, and as more water mass is added to the oceans from the melting of land-based ice sheets and glaciers.
ENSO and global sea level
Massive water volumes are also exchanged between the land and ocean connected with the ENSO phases, La Nina and El Nino. During La Nina there is typically an increase of rain and snow falling over land, which corresponds with a fall in global sea level. With El Nino, the atmosphere warms, drying out much of the global land surface and shifting rainfall over the ocean. This brings about a rise in global sea level. See image below:
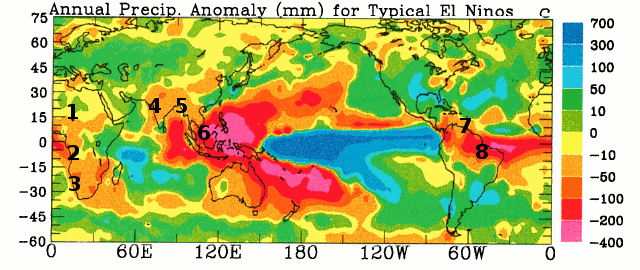
Figure 3 - annual precipitation anomalies (in mm) for typical El Nino. Note that yellow and light-green colors indicate statistically insignificant values. See Dai & Wigley (2000). Numbers represent the 8 largest tropical river basins 1) Niger, 2) Congo, 3) Okavango, 4) Indus, 5) Ganges, 6) Mekong, 7) Orinoco, 8) Amazon. See discussion below.
As mentioned in the Amazon drought posts, the Walker Circulation is shifted over the tropical Pacific during El Nino, causing the moisture evaporated from land and sea to fall back over the ocean, rather than over the Amazon. El Nino also causes serious drought over Australia, and drying of Southern Africa, India and South East Asia, so much of that land-based moisture ends up back in the ocean too.
Recent research, Llovel (2010), has found that tropical river basins, such as the Amazon, are the main contributor to the EL Nino/La Nina exchange of water mass with the ocean, and the Amazon is a major contributor to the seasonal variation too. For clarity, I've labelled figure 3 with the location of the 8 main tropical river basins which contribute to ENSO-based fluctuations in sea level. Note how all the tropical river basins tend to dry out during the El Nino phase. Now compare with the period March 2010- March 2011, which was in the grip of a particularly powerful La Nina:
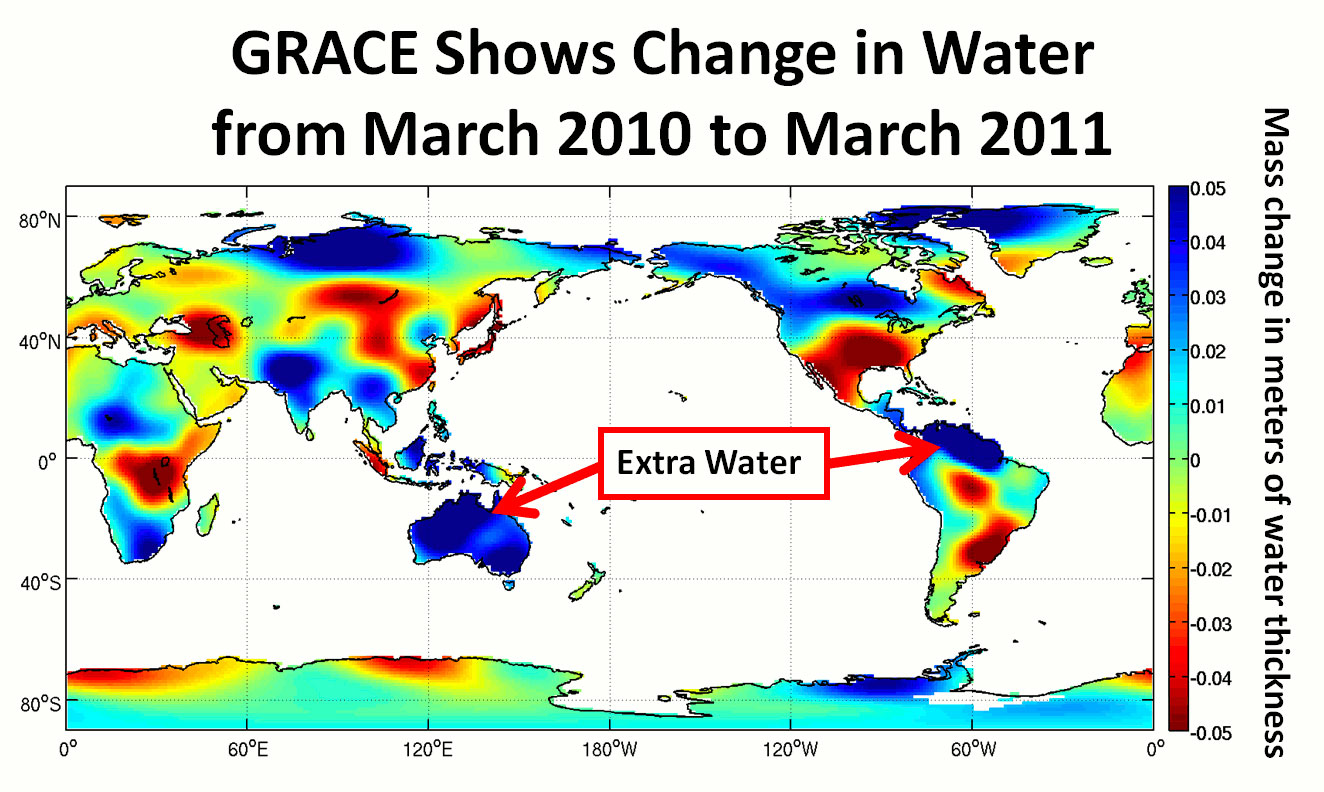
Figure 4 - change in land-based global water storage in the period March 2010-March 2011, as observed by GRACE gravity satellites. Image from NASA JPL.
All tropical river basins, apart from the Congo, have gained extra water throughout the latest La Nina. The huge increase in water mass over the Australian continent is rather hard to miss too. Not surprising given the enormous flooding there in the last year.
This regular fluctuation of sea level (falling during La Nina, and rising during El Nino) has been observed throughout the period of satellite-based sea level monitoring (1993 onwards). This can be seen in the de-trended (long-term trend removed to enable comparison) data in figure 5 below. Note that both the Multivariate ENSO Index (MEI, a measure of ENSO), and the related sea level change, fluctuate about zero. In other words ENSO does not contribute to long-term sea level.
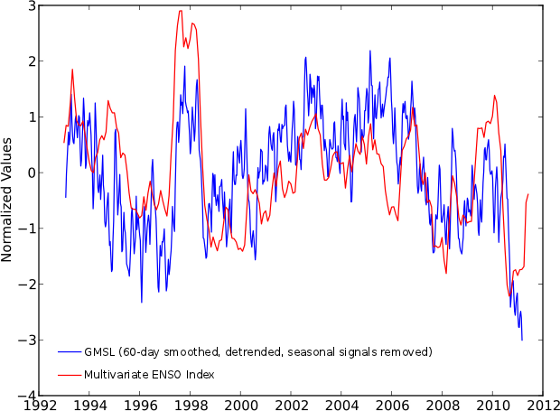
Figure 5 - To compare the global mean sea level to the MEI time series (a measure of ENSO), the mean, linear trend, and seasonal signals from the 60-day smoothed global mean sea level estimates have been removed, and each times series normalized by its standard deviation. The normalized values plotted above show a strong correlation between the global mean sea level and the MEI, with the global mean sea level often lagging changes in the MEI. Image from the University of Colorado sea level research group page.
Joining the dots
We regularly get "skeptics" posting here, pointing out the large drop in sea level during 2010, however it never seems to occur to them why sea level dropped. That water hasn't just magically disappeared, it's simply found a new temporary home on land, as the residents of Vermont in the USA have sadly just experienced. But it is only temporary, eventually all that water held in lakes, wetlands, rivers, soils and vegetation will find its way back into the ocean, and sea level will rise again. Long-term, expect the sea to continue rising as the oceans warm and melting glaciers and ice sheets constantly add more water to the oceans, but don't be surprised if there's a large pothole, or speed bump, along the way.
Intermediate rebuttal written by Rob Painting
Update July 2015:
Here is a related lecture-video from Denial101x - Making Sense of Climate Science Denial
Last updated on 11 July 2015 by MichaelK. View Archives


 Arguments


[DB] "I'd be glad to read your views on the percentage increase in airborne water vapour that the missing water now represents"
Lewis, remember that atmospheric water vapor excesses have a residence time of about 9 days. Thus that water piled up onto land masses has a slow trek through cachments, impoundments and reservoirs on its way back to the sea. And some will make its way into water tables as well.
I think that this short-term decline from lanina isn't affected much because it will back to the same situation. But its effect much on the climate of that area. How is it increasing amount of greenhouse gases?
Why did sea level fall in 2010?
This exchange in the Fall of 2011 presents a fascinating discussion of the relationship between global mean sea level and water transfer to land masses. Specifically, the apparent temporary downtrend in sea level around 2010 was purported to be explained at least partially by torrential rainfall in Australia and elsewhere. BUT the accumulation of rain on land was not nearly enough to account for the sea level drop. The discussion trails off in December 2011 without a resolution of the discrepancy. And the anthropogenic increase in sea level resumed its upward trend in 2012.
Was this discrepancy ever resolved? Does the discrepancy have implications regarding the accuracy annd relliability of satellite measurements? Is this related to the later downturn in sea level in the 2016 timeframe?
VR, richieb1234
[DB] NASA has continued to track water motions across the planet, from alpine and ice sheet mass losses to the ocean and land impoundment changes over time, including torrential rains in the Amazon and Australia lowering global sea levels for a time. The overall trend is upward with the net effect that global sea level rise is accelerating in lockstep with accelerating ice sheet mass losses. NASA has a video on GRACE's 15-year mission tracking that, here.
Richieb @21 , I am not clear about the nature of your inquiry. Australia (the part that gets rained upon!) is about 3% of the world's land area . . . so presumably it was the other 140-ish million square kilometers receiving the bulk of the "missing" ocean water. Spread kinda thin, even allowing for local concentrations (see chart in OP).
Water runs off quickly and returns to the ocean, or soaks into the soil for a year or two ~ and eventually trickles back to the ocean, or evaporates and rains into the ocean. All part of the normal variation of things.
There doesn't seem to be any discrepancy requiring special explanation. There are always small ups and downs imposed on top of the continuing rise in sea level.
RitchieB,
I do not think that there was ever a "discrepancy" to be corrected in the comments above. The first commentor says they are a "layman" who eyeballs a graph and does some rudimentary calculations. The responding posters cite Llovel et al 2010 which states in the abstract:
"We show that whatever the period considered, interannual variability of the mean sea level is essentially explained by interannual fluctuations in land water storage, with the largest contributions arising from tropical river basins"
Obviously the laymans eyeball is not as accurate as professional scientists calculations. If you want more information Google Scholar says Llovel has been cited 84 times. If you read the titles of the papers you can find one that answers your questions. Here is one I looked at. In the abstract it says all the fall in sea level in 2010-2011 is caused by land storage.
If you look at the intermediate level of the explaination of this myth here at SkS, there is a graph that shows the yearly seasonal variation of sea level in the Northern Hemisphere varies by about 60 mm and the Southern Hemisphere varies by about 30 mm. It seems reasonable to me that a change in rainfall could cause 10 mm yearly change for a short time when seasonal variation is so much larger.