Climate Science Glossary

Term Lookup

Enter a term in the search box to find its definition.

Settings

Use the controls in the far right panel to increase or decrease the number of terms automatically displayed (or to completely turn that feature off).

Term Lookup

Settings


All IPCC definitions taken from Climate Change 2007: The Physical Science Basis. Working Group I Contribution to the Fourth Assessment Report of the Intergovernmental Panel on Climate Change, Annex I, Glossary, pp. 941-954. Cambridge University Press.

Home Arguments Software Resources Comments The Consensus Project Translations About Support

Bluesky Facebook LinkedIn Mastodon MeWe

Twitter YouTube RSS Posts RSS Comments Email Subscribe


Climate's changed before
It's the sun
It's not bad
There is no consensus
It's cooling
Models are unreliable
Temp record is unreliable
Animals and plants can adapt
It hasn't warmed since 1998
Antarctica is gaining ice
View All Arguments...


Username
Password
New? Register here
Forgot your password?

Latest Posts

Archives

Simply Wrong: Jan-Erik Solheim on Hansen 1988

Posted on 19 June 2012 by dana1981

The myth that Hansen's 1988 prediction was wrong is one of those zombie myths that always keeps coming back even after you chop its head off time and time again.  The newest incarnation of this myth comes from Jan-Erik Solheim, who in a 272 word article promoted by Fritz Vahrenholt and Sebastian Lüning (translated by the usual climate denial enablers here) manages to make several simple errors which we will detail here.

Whopping Wrong Temperature Change Claim

Solheim claims that "Hansen’s model overestimates the temperature by 1.9°C, which is a whopping 150% wrong."  Yet Scenario A - the emissions scenario with the largest projected temperature change - only projects 0.7°C surface warming between 1988 and 2012.  Even if emissions were higher than in Scenario A (which they weren't, but Solheim wrongly claims they were), they would have to be several times higher for Hansen's model to project the ~2.3°C warming over just 23 years (1°C per decade!) that Solheim claims.  Solheim's claim here is simply very wrong.

CO2 is Not the Only Greenhouse Gas

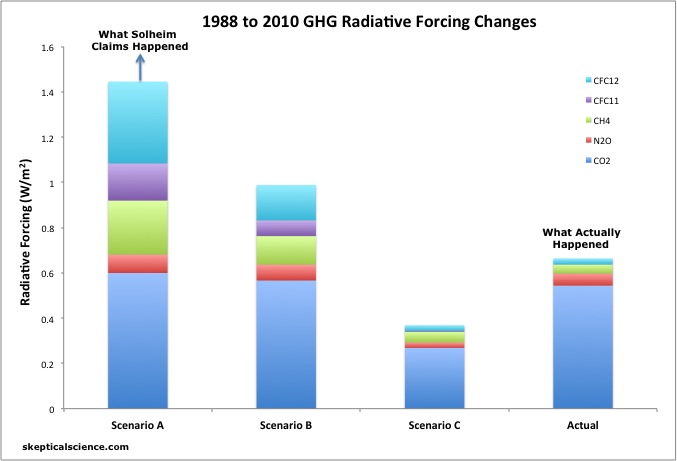
Quite similar to Patrick Michaels' misrepresentation of Hansen's study back in 1998, Solheim claims that Hansen's Scenario A has been closest to reality by focusing exclusively on CO2 emissions.  However, the main difference between the various Hansen emissions scenarios is not due to CO2, it's due to other greenhouse gases (GHGs) like chlorofluorocarbons (CFCs) and methane (CH4), whose emissions have actually been below Scenario C (Figure 1).  In fact, more than half of the Scenario A radiative forcing comes from non-CO2 GHGs.

solheim vs reality

Figure 1: Radiative forcing contributions from 1988 to 2010 from CO2 (dark blue), N2O (red), CH4 (green), CFC-11 (purple), and CFC-12 (light blue) in each of the scenarios modeled in Hansen et al. 1988, vs. observations (NOAA).  Solheim claims the actual changes were larger than Scenario A (indicated by the blue arrow).  In reality they were smaller than Scenario B.

Wrong on Temperature Data

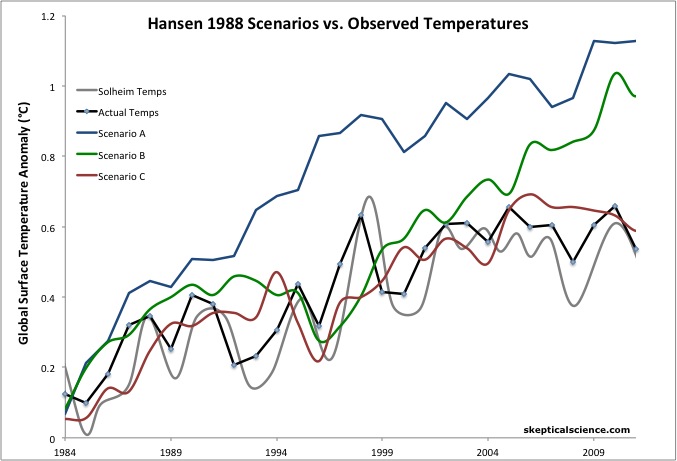
Solheim also produces a very strange plot of what he claims is "the ultimate real-measured temperature (rolling 5-year average)."  His plot shows the purported 5-year running average temperature around 1998 as hotter than at any later date to present, which is not true of any surface or lower atmosphere temperature data set. It appears that Solheim has actually plotted annual temperature data, or perhaps a 5-month running average, most likely from HadCRUT3, which has a known cool bias and has of course been replaced by HadCRUT4.  There is simply no reason for Solheim to be using the outdated data from HadCRUT3.

Figure 2 shows what the comparison should look like when using the average of HadCRUT4, NASA GISS, and NOAA temperature data sets.

Hansen vs Obs vs Solheim

Figure 2: Hansen's 1988 Scenario A (blue), B (green), and C (red) temperature projections compared to actual observed temperatures (black - average of NASA GISS, NOAA, and HadCRUT4) and to Solheim's temperature plot (grey).

Wrong Conclusion

Ultimately Solheim's concluded "The sorry state of affairs is that these simulations  are believed to be a true forecast by our politicians."  However, even if global climate models from several decades ago didn't have the remarkable record of accuracy that they do, current day clmate modeling is far more sophisticated than that done by Hansen et al. nearly a quarter century ago.  Climate models are now run on some of the world's fastest supercomputers, whereas Hansen's was run on a computer with substantially less computing power than a modern day laptop.  While climate model forecasts are imperfect (as are all forecasts), they have thus far been quite accurate and are constantly improving.

What Can We Learn From This?

The observed temperature change has been closest to Scenario C, but actual emissions have been closer to Scenario B.  This tells us that Hansen's model was "wrong" in that it was too sensitive to greenhouse gas changes.  However, it was not wrong by 150%, as Solheim claims.  Compared to the actual radiative forcing change, Hansen's model over-projected the 1984-2011 surface warming by about 40%, meaning its sensitivity (4.2°C for doubled CO2) was about 40% too high.

What this tells us is that real-world climate sensitivity is right around 3°C, which is also what all the other scientific evidence tells us.  Of course, this is not a conclusion that climate denialists are willing to accept, or even allow for discussion.  This willingness to unquestioningly accept something which is obviously simply wrong is a good test of the difference between skepticism and denial.  Indeed, in misrepresenting Hansen's results, Solheim has exhibited several of the 5 characteristics of scientific denialism.

0 0

Printable Version  |  Link to this page

Comments

1  2  Next

Comments 1 to 50 out of 87:

  1. This is an example of what happens when you try to win rather than understand. Rater than try to understand Hansen's calculations and then criticize based on that understanding Solheim has read Hansen maliciously, looking to find fault and missing context and reasoning. Hardly the only denialist that I have seen do that. In fact most of their rebuttals of climate science pieces suffer from this flaw, at least in my experience.
    1 0
  2. "most likely from HadCRUT3, which due to its cool bias has of course been replaced by HadCRUT4..." This could be worded better ... it can be read as though HadCRUT4 was created for exaclty the reasons denialists claim adjustments are made to various temperature datasets, to make things seem worse than previous work indicated. HadCRUT4 was released because it has better coverage. Which just happens to remove the cool bias HadCRUT3 suffered from because of more limited coverage ... Anyway, call me paranoid but we don't want to toss the denialsphere things that can easily be quote-mined, right?
    0 0
  3. Except that HadCRUT4 didn't really address the coverage bias either.
    0 0
  4. Lloyd @1 - I agree, the reason this myth persists is that certain individuals desperately want Hansen and co. to be "wrong", so once they arrive at that desired conclusion, their brains shut down and they don't investigate further to see what Hansen being "wrong" means (what it means is that fast feedback climate sensitivity is ~3°C, which is what Hansen currently argues). I still have yet to see a climate contrarian perform an intelligent and throrough analysis of Hansen's 1988 projections. Solheim, Michaels, Christy, etc. all stop when they reach the convenient "Hansen was wrong" conclusion. dhogaza @2 - fair point, I re-worded that sentence, although as Kevin notes, it's not quite as simple as just having better coverage. The point I was trying to get at is that Solheim should not be using HadCRUT3 when it has a known cool bias and has been replaced by HadCRUT4. There is absolutely no reason to continue using an outdated data set like HadCRUT3, unless of course the outdated data are convenient for the argument you're trying to make.
    0 0
  5. dana1981 - wording's better, thanks.
    0 0
  6. Should we not be factoring in the ENSO, insulation & volcanic effects (as per Foster and Rahmstorf 2011)? Jan-Erik Solheim's "whopping 150% wrong" pronoucement, show here to be actually "about 40%," would thus shrink further still to something like 20% and also suggesting climate sensitivity is (worryingly) somewhat higher than ~3.0°C.
    0 0
  7. MA @6 - I did use the F&R trend of 0.17°C per decade in comparing to the Hansen model-projected warming. Bear in mind this is a very rough climate sensitivity estimate, since we're looking at transient temperature changes right now, but talking about equilibrium model sensitivities.
    0 0
  8. He lost me at "150% wrong". There's no evidence of scientific literacy there at all.
    0 0
  9. For Figure 2, the above statement "His plot shows the purported 5-year running average temperature around 1998 as hotter than at any later date to present, which is not true of any surface or lower atmosphere temperature data set" contains a link to a "woodfortrees.org" plot. But if you use Roy Spencer's website, the 13-month running mean clearly shows that 1998 and 2010 are tied (+0.4)C. So the assertion that 1998 was not hotter than at any later date is a bit misleading. Both 1998 and 2010 were peaks in global averaged temperatures in response to El Nino events.
    0 0
  10. poodle - first of all, 13 months is not 5 years. Secondly, UAH is a lower troposphere temperature data set, not a surface temperature data set, and the Hansen 1988 projections were of surface temps. Third, 1998 is only hotter in UAH because El Nino is amplified more in atmosphere than surface temps (hence you shouldn't be comparing the two).
    0 0
  11. 10 dana1981 What's the difference between a lower troposphere temperature data set and a lower atmosphere data set? Why not say "which is not true of any surface temperature data set" and leave "or lower atmosphere data set" out of the sentence. What do you mean by "lower atmosphere data set"?
    0 0
  12. thepoodlebites - Looking, as you suggest, at the WoodForTrees data (with a 60 month running mean, as per the actual discussion here), not even the RSS data shows 1998 as the peak anomaly, let alone UAH. So no, 1998 is not the peak year in either surface or lower tropospheric temperature data 5-year averages. Clearly, Solheim was not using a 5-year uniform mean filter; perhaps a Loess smooth, a tapered mean, or a shorter period? My best reconstruction of his graph is actually with an approximately 13-month running mean. At the very least he has poorly labeled/explained his data. Now - What point were you trying to make?
    0 0
  13. poodle, the troposphere is the lowest layer of the atmosphere. KR - I believe poodle's point is that there exists a data set with a certain smoothing for which the data around 1998 is hotter than the subsequent data. However, that argument is a strawman, because nobody said anything to the contrary. The above post correctly noted that there is no data set for which 1998 is hotter than subsequent years when a 5-year running mean (which Solheim claimed to apply) is used, as you show in your link (also linked in the post). It appears that rather than addressing the meat of the post, poodle is trying to pick nits, but his nits are made of straw.
    0 0
  14. It appears that rather than addressing the meat of the post, poodle is trying to pick nits, but his nits are made of straw.
    I completely agree, but I'm afraid I will have to arrest you for Crimes Against Metaphor... ;-)
    0 0
  15. Bill, haven't you heard of a "Straw Nit" fallacy before ...
    0 0
  16. Bill, you're accusing me of persnickety strawmen but I'm just trying to understand the woodfortrees.org plot. Thanks Dana1981. A 60-month average definitely changes how one interprets the observations. I've included the 13-month UAH plot and we can clearly see the 1998 and 2010 El Nino events. I agree that Solheim's 1998 peak seems exaggerated but this doesn’t change the argument that Hansen’s 1998 temperature predictions (both A and B) were too warm. I’m still skeptical about actual emissions being closer to B but will study more about that. I guess you can accuse me of being a nit-pick about the empirical evidence but it represents the best ground truth that we have so far.
    0 0
  17. 18. Belay my last, make that Hansen's 1988 (not 1998) temperature predictions (both A and B) were too warm. Sorry about that, I try to be careful. Those responsible for sacking the people who have just been sacked, have been sacked.
    0 0
  18. Poodle, the problem might be that you are not noting that everyone, Hansen included, accepts that Hansen's sensitivity of 4.2°C for doubling of CO2 was wrong at least for the short term. This is something that I have repeatedly pointed out to deniers but it is almost never acknowledged. SO yes his predictions are too warm for that reason. Also there are numerous factors such as Asian aerosols, persistence of La Niña, etc, that could be dampening the effects of CO2 on the short term as well. That could also "make" his "predictions" wrong" but not his science.
    0 0
  19. poodle, Hansen's scenarios are projections, not predictions. A projection is "if x happens, then y will happen as a result." Since emissions didn't follow either Scenario A or B exactly, we wouldn't expect the Scenario A or B temp projections to be perfect. So to say Scenario A and B ran too hot - that's exactly what we would expect to happen. We would also expect the temperature rise to be about 16% below Scenario B if Hansen's model were perfect, given actual emissions. It wasn't, because as tonydunc and myself and others have noted, the model sensitivity was 4.2°C for doubled CO2 which is probably too high. Accounting for the difference, it tells us that fast feedback equilibrium sensitivity is around 3°C.
    0 0
  20. (-Snip-)
    0 0
    Moderator Response:

    [DB] For many months now you have been bombing threads with comments focused on timeframes too short to be of any significance. In short, you continually focus on the "noise", not the "signal". And this, despite repeated counseling to the contrary. This constitutes "sloganeering" and is in violation of the comments policy.

    Continuance of this pattern of posting behavior will result in an immediate cessation of posting privileges.

  21. As an interesting side note, while Hansen 1988 has rather too high a sensitivity, and somewhat overestimates the actual warming trend based on actual emissions, Hansen et al 1981 underestimated those trends by ~30%, and still beat "no-change" or "linear trend" predictions. By no means were either the 1981 or 1988 models perfect - which, if you actually read the papers, Hansen states repeatedly. Aerosols are an ongoing issue, as is the exact level of cloud feedback. But making comparisons to the 1988 Scenario A (as Solheim did) is a complete strawman fallacy, and as per the lessons from predictions series documents, actual science does a much better job of predicting outcomes than the 'skeptic' models or claims.
    0 0
  22. It is just amazing to me that "skeptics" can't understand something as utterly simple as this, and that "skeptic-wannabees" latch so readily onto arguments like this one, without the slightest trace of skepticism (because if they had, they'd immediately see how silly this position is). Why is it that we never, ever see the skeptic sheep step up and say "wait a minute, that's not right." I mean, with all of the ridiculous arguments that are out there, how come not once do the skeptics go "wait, this is embarrassing." Everything from this constant attack on 1988 Hansen, to attacks on 1999 Mann, to Postma's nonsense... Really? Skeptics can't take any of these laughable arguments to task? Not one?
    0 0
  23. thepoodlebites @16, here are Hansen's projections for various GHG concentrations in 2011, and the current (2011) annual concentrations for those gases: Year: 2011 Actual Scen A Scen B Scen C CO2 (ppmv) 390.5 393.74 391 367.81 NO2 (ppbv) 322.5 334.1 329.94 313.93 CH4 (ppbv) 1810.5 2617.77 2234.52 1915.84 CFC11 (pptv) 240 1220.89 553.99 275.49 CFC12 (pptv) 533 2096.56 960.92 523.59 You will notice that for all values,the closest value is either Scen B or Scen C, and that only three values (CO2, NO2 and CFC12) exceed scenario C, with none exceeding Scenario A. There is no basis for being skeptical about actual emissions being closer to B other than a determination to ignore the evidence.
    0 0
  24. Dana, statististical significance for a trend does not depend on the length of the time scale. It depends on the probability (usually 1 chance in 20) that the observed trend is different from zero. This depends on the signal (if any) to noise ratio. More precisely, on the variance explained by the regression divided by the residual variance. For example, Tamino in his post on diminishing Arctic sea-ice claims significance for 10 year data. My "moderated" posts are all based on original data, scrupulously tested courtesy of Excel. What has this to do with Hansen's predictions/projections? Very little. His projections are the nearest thing we have in Climate Science to an appropriate test in the Popperian sense. He makes predictions based on his theory, which can be tested by events. It is the temperatures that matter, Tom, not the CO2 predictions. Clear your mind, Dana, and look at the Real Climate Chart. The A line temperatures climb steeply after 1990, and head off the page. It was originally the "business as usual" but is now disowned. The B line, which Real Climate claim as the "real" prediction diverges sharply from both the C line and the actuals after 2006. To date the divergence is almost 0.5 degrees C. Actual temperatures are somewhat behind the "C" line, comprehensively contradicting the projections, and the science behind them. Now of course this may change. The "C" and "B" lines must continue to diverge, but the actual temperatures may change direction and move close to the "B" line. If this happens I will change my mind on AGW. If it does not happen, Dana, what will you do?
    0 0
  25. Fred Staples wrote: "Dana, statististical significance for a trend does not depend on the length of the time scale. It depends on the probability (usually 1 chance in 20) that the observed trend is different from zero." The probability that the observed trend being different from zero depends on the noise in the observations, on the size of the actual trend and on the amount of observations you have. It is fairly obvious even yo a non-statistician that the more noise you have, the more difficult it will be to detect a non-zero trend. Likewise the larger the trend actually is, the more easy it will be to detect if it is actually there. Similarly, a longer period gives more evidence on which to base the decision, and obviously it is easier to detect a non-zero trend if you have more evidence. The real problem with the statistics of trends is not in statistical significance, but a lack of statistical power (that is a statistical term with a specific meaning), which means that the probability of rejecting the null hypothesis when it actually is false is very small. This means that the statistical test is essentially meaningless as you would expect not to be able to reject the null hypothesis for short timescales even if the planet is warming at the rate suggested by the IPCC projections.
    0 0
  26. I do understand statistical power, Dikran, and the way that sample size reduces the probability of a type 2 error. But that is not the issue here. The divergence between lines A, B, and C stems from the CO2 driven AGW theory that Hansen built into his model. Lines B and C must continue to diverge, because Hansen line C assumes no increase in CO2 emissions after year 2000. Up to year 2006 the GISS. HardCrut3, B and C lines moved together. After 2006 B and C diverged, and the temperatures and the C line moved together, contradicting the theory. Now I agree that there is a calculable probability that the actual temperatures will one day leave the C line and head off along the B line. It is also certain that the greater the B to C divergence, and the longer temperatures continue to follow C, the lower will be that probability. I make two assertions. One, it has not happened yet, and two, when the probability becomes vanishingly small we must reject the AGW theory.
    0 0
  27. "I make two assertions. One, it has not happened yet, and two, when the probability becomes vanishingly small we must reject the AGW theory." Or, we must reject Hansen's earlier 4.2C sensitivity to a doubling of CO2 as being too high ... which we already know it is. And there is no "AGW theory" per se. Expected warming is a consequence of physics and a wide range of knowledge of climate, paleo, past and present. You can't reject "AGW theory" without overturning 100 years of science covering a range of things. Good luck, Fred.
    0 0
  28. Fred, saying that "statististical significance for a trend does not depend on the length of the time scale" clearly suggests that you don't understand statistical power. If the timescale is too short for the test to have useful statistical power then the "Popperian test" is meaningless as lack of statistical significance is what we would expect to see even if the null hypothesis is false. Statistical power depends on the timescales involved, so if you want a fair Popperian test then you need to show that the timescale is long enough for the test to have adequate statistical power. If you want to suggest a fair Popperian test, then that is something that I would be very much in favour of. However the onus is on you to perform the analysis of statistical power required to show that the test is reasonable.
    0 0
  29. Fred, 26, No. The divergence stems from comparing apples to oranges. Known differences:
    • Large differences in the amounts of other major greenhouse gases (CH4, CFC12, etc.)
    • Incorrectly chosen climate sensitivity (4.2 vs. 3)
    • Greater aerosols (see China)
    • Lower solar output
    • A recent, probably random spate of La Niña episodes
    This is very simple, and is stated very clearly in the original post. You simply cannot compare any of the projections to the actual course of events because the underlying premise is invalid. It's like arguing that the 1985 Chicago Bears were the greatest American football team ever. It's an impossible stance to ever prove because there's no way to get them to play teams from other era's, and there are too many changes between eras (steroids, rules, population, finance, etc.). It's just a silly position to adopt. It's hard to refute, because the bottom line is that it's silly to begin with. The original post explains this clearly enough. Your constant rejection of the facts amounts to sticking your fingers in your ears and saying "nah, nah, nah, I'm-not-listening."
    0 0
  30. I probably know less about statistics than any other participant on this thread, but at least I can spot a fallacy of composition, such as: Dana, statististical significance for a trend does not depend on the length of the time scale. It depends on the probability (usually 1 chance in 20) that the observed trend is different from zero. Fred appears to assert that in noisy time series the chosen temporal resolution should not mask discerning the trend - and there lies the fallacy. In addition: My "moderated" posts are all based on original data, scrupulously tested courtesy of Excel. seems like comedy gold.
    0 0
  31. Dana, would you please let me know how you do it? You state in the post that, "The observed temperature change has been closest to Scenario C", and not a peep from the SkS faithful. I stated that, "Hansen's Scenario C actually gives the best fit to the GISS temperature data, not Scenario B" in SkS Lindzen Illusion #2: Lindzen vs. Hansen here. However, I was castigated by the Moderator (DB) and by the SkS faithful. You weren't. A typical comment against me was (by DB), " Repeating a misunderstanding does not unmake it as a misunderstanding ." Dana, I do not see any material difference between my statement and your statement. DB, is Dana repeating a misunderstanding? It just goes to show that it's not what you say but who says it.
    0 0
  32. angusmac: There is rather a large difference between what dana1981 wrote in the OP and what you assert he wrote. He followed up the statement you quoted with: but actual emissions have been closer to Scenario B. This tells us that Hansen's model was "wrong" in that it was too sensitive to greenhouse gas changes. However, it was not wrong by 150%, as Solheim claims. Compared to the actual radiative forcing change, Hansen's model over-projected the 1984-2011 surface warming by about 40%, meaning its sensitivity (4.2°C for doubled CO2) was about 40% too high. which is rather different from what you were going on about on page 2 of this comment thread. I find it interesting that you have omitted reference to this comment thread (which fleshes out the SkS response to your claims) in your complaint about DB's moderator add-on just as you have omitted the rest of dana1981's statement in the OP.
    0 0
  33. Fred Staples and angusmac - you're being distracted by curve C. Scenario C did not come to fruition, so focusing on that scenario becomes a red herring. It's true that coincidentally, temperatures have risen at a rate similar to Scenario C so far. But you're drawing the wrong conclusions from that. The main reason temperatures are following C is that Hansen's model was probably too sensitive to CO2 changes. If his model had a sensitivity of around 3°C, Scenario B would have accurately reflected the observed temperature change (or more precisely, a trend 16% lower than Scenario B, since the actual forcing has been 16% lower). By focusing on the coincidence that temps happen to have risen at a similar rate as Scenario C thus far, you're completely missing the point and failing to actually learn anything from Hansen 1988, as noted in the final section of the above post.
    0 0
  34. Angusmac @31, as one of the "SkS faithful" (a condescending term I object to) I note that you actually wrote:
    "Illuminating post Dana but you neglect to mention that Hansen's Scenario C actually gives the best fit to the GISS temperature data, not Scenario B."
    (My emphasis) I responded by showing that Dana had shown that temperatures tracked Scenario C best (contrary to your claim), but that if the predictions where scaled based on the ratio between the climate sensitivity of Hansen's original model and the mean of modern accepted values, temperatures track Scenario B - a point you do not acknowledge. That is an interesting point. What is neglected by deniers in their continuous attacks on Hansen 88 is that modern estimates of climate sensitivity have already been adjusted down relative to that model. Indeed, they where adjusted down in 1998 when temperatures where tracking well above scenario B even though forcings at that time where tracking below scenario C. That is because climate scientists look at the full range of data, and do not restrict themselves to try and falsify the whole theory based on the performance of an obsolete model from twenty five years ago. Interestingly, that obsolete model is still doing much better than it is given credit for. Currently GHG forcings are tracking almost exactly half way between Scenario C and Scenario B (see OP). The Scenario C prediction has a linear trend of 0.15 C/decade. The Scenario B prediction has a linear trend of 0.19 C/decade. Based on the ratio of forcings, therefore, we would expect temperatures to be tracking at about 0.17 C per decade. It turns out, once you correct for ENSO and the declining insolation over the last 30 years (not included in Hansen's forcings), that is exactly where the temperature is tracking:
    0 0
  35. angusmac, Like Fred, you completely miss the point and oversimplify the issue, then you fail to understand the distinctions when they are pointed out to you (as evidenced by the thread to which you pointed), and then you accuse everyone else of duplicity because you can't seem to understand the nuances. Stop oversimplifying things. Read and understand the posts. As an aside, phrases like "the SkS faithful," while otherwise not endearing you to anyone who disagrees with you (if you want to speak like that, go post with the WUWT your brethren on WUWT) also skirts close to the edge of the comments policy.
    0 0
  36. Tom @36 - the Scenario B trend is closer to 0.27°C/decade. Account for the forcing being 16% higher than reality and the sensitivity being about 40% higher than the current best estimate, and you get the observed 0.17°C/decade.
    0 0
  37. dana @36, you are correct. I mistakenly reported the trends from 1958-2011. Correcting to report the trends from 1979-2010 to make them directly comparable with Foster and Rahmstorf, they are: A - 0.32 C/decade B - 0.27 C/decade C - 0.22 C/decade which shows the point I made in the final paragraph of my preceding post to be completely incorrect. Thank you for correcting my error.
    0 0
  38. Dana @ 33... I think you're exactly right about scenario C. It's a big distraction because nothing close to that happened in terms of forcing. It would be reasonable to just pretend it's not even there. It's well accepted that scenario B is the closest to Hansen's forcing projections. That leaves you with a GISS temperature trend that is below scenario B at Hansen's 4.2C for CS. And even in Hansen's paper he mentions the fact that the NAS had estimated CS at 3C. So, it seems pretty darn logical to adjust Hansen's model for 3C, because it's not the forcing we're trying to rationalize, it's Hansen's model. Do that and you get a close match between GISS and Hansen's projections. I really fail to see why this is so hard for skeptics to comprehend.
    0 0
  39. I find it hard to really comprehend what they are getting at. Are they saying that they favour Hansen's 4.2 sensitivity and thus arguing forcing must be Scenario C (when clearly they are not). Or simply arguing that Hansen had sensitivity too high (which you could see without Scenario C being there) which is generally agreed. Or arguing that the issues with Hansen's 1988 model (which they could probably run on their phone these days) conclusively disprove climate science for all time and we go back to putting more coal on the fire.
    0 0
  40. Ooooh, scaddenp! Now there is an iPhone app I'd like to have!
    0 0
  41. I've been arguing with someone about Hansen's paper over on Peter Sinclair's YT channel for days now. The only thing I can get is that the only point they want to make is that Hansen was wrong. Whatever it takes, he was wrong. And he was wrong... in using 4.2C for climate sensitivity. After that his model works pretty well. It seems lost on people that Hansen was not trying to model CS. He was modeling temperature, so adjusting the CS to see how the model is performing is reasonable.
    0 0
  42. iphone - dunno. You have to get Fortran working. (GCM Model 2 I think). I think Android and gfortran would be easier. On the other hand, its "maintained" on OS X, intel compiler. I should admit right away that I dont even own a smart phone and have never seriously looked at developing on one. On the other hand, the specs for computer in 1988 compared to smart phone are pretty good.
    0 0
  43. For anyone who actually wants to run the GISS model II, the source code is still available online here.
    0 0
  44. The unzipped source code, it turns out, is all of 284 kbs. Despite this small size, when run in 1983 it took up to much computer time to do a full repeat run when the memory was corrupted during one experiment (see the caption of fig 3 (PDF)). Remembering the limited computer capacity of those days is making me feel old.
    0 0
  45. Indeed. My first computer of that era, a Commodore-64®, had an available free RAM of just 37k. Despite this limitation, software engineers compiled very playable game code (for what other commercial purpose yields so much potential revenue?) for games still playable today (just today I learned that the old C-64 staple, Sword of Fargoal, is now available for the Iphone!).
    0 0
  46. Rob @41 - yes, climate contrarians only seem interested in concluding 'Hansen was wrong', hence the final two paragraphs of the above post. Of course he was 'wrong' because all models are 'wrong', but his results are also useful in telling us climate sensitivity is in the ballpark of 3°C. However, I'd describe the study as Hansen trying to model the global climate as best as he could at the time, and then seeing how his model would project future climate changes, temperature changes being the main focus of those projections. The fact that he projected too much warming is a result of the model sensitivity being too high, which is a result of the model being an imperfect representation of the climate. Models will of course always be imperfect, but they have also improved dramatically over the past nearly quarter century.
    0 0
  47. Tom Curtis@34 & Sphaerica@35 I apologise if you find the term "SkS faithful" condescending but at least it is not abusive in the way that the term "denialist" is. Yet, "denialist" frequently populates SkS. Furthermore, if you check the synonyms for "faithful" from the Cambridge Dictionary here and shown below for ease of reference they suggest, "as-good-as-your-word, reliable, consistency". There is nothing condescending in the above synonyms for "faithful". To the contrary the term "denialist" is objectionable and insulting when applied to someone who has valid but contrary scientific views. It is most objectionable when applied to climate change sceptics because it conjures up the spectacle of a fanatic denying the Holocaust. To call someone who is sceptical about a theory, e.g., AGW, a "denialist" is an insult to the way that real science works. Notwithstanding the above, neither Tom nor Sphaerica called me a "denialist", although Sphaerica did suggest that I post on WUWT. No thanks Sphaerica. In my occasional posts, I prefer to try to advance rational scientific debate on this site.
    0 0
    Moderator Response: [Dikran Marsupial] A common rhetorical device used by skeptics in the climate debate is to portray the mainstream view as a religion with followers blindly acting on faith rather than rationally. Thus talking of the "SkS faithfull" is likely to be inflamatory, as is "denialist" (as noted in the comments policy). Please let us all avoid the use of either term (or variants) in the interest of productive discussion of the science. Further discussion of the meanings of "faithful" and "denialist" are off-topic and will be deleted.
  48. Moderator@47 thank for the off-topic clarification. Dana@33 (also Tom Curtis@34 & Sphaerica@35) I am not missing the point regarding Scenario C being the best fit for actual temperatures – whether coincidental or not. Nevertheless, instead of using the "incorrect" Scenario C , I shall try to explain by using Dana's amendment to Scenario B, which I will call Scenario D. In Scenario D, Dana multiplies the Scenario B data by a factor of (0.9*3/4.2), which equates to temperature sensitivity of 2.7°C. I assume that the Scenario D multiplication factor is based on the approximation in Schmidt (2009). The resulting temperatures are compared with Hansen's projections in Figure 1 (see SkS for the Scenario D data and GISS for real-world temperatures). Figure 1: Hansen's 1988 Scenarios compared with Real-world Temperatures It is evident from Figure 1 that the differences between Scenarios A and B and the "correct" Scenario D are huge. They certainly are not small, nor are they of the order of 10% as stated in RealClimate (2011). I summarise the conclusions from the scenarios and the real-world data compared with Hansen (1988) as follows:
    • Temperature projections for 2019 have plummeted from 1.57°C in 1988 (Scenario A) to 0.69°C in 2011 (Scenario D).
    • Estimates of actual temperature (LOTI) for 2012 are in error by ≈ 60% for Scenario B and 127% for Scenario A.
    • Climate sensitivity has fallen from ≈ 4.2°C to ≈ 2.1-2.7°C, i.e., it has fallen to 50-64% of Hansen's 1988 estimates.
    The above errors do not represent pretty good estimates. They are actually pretty bad and I look forward to SkS's defence of these bad results.
    0 0
  49. @angusmac in your opinion, how close an agreement should we expect to see between a "good" projection and the observations? I ask this because the model projections are necessarily only a projection of the forced component of climate, whereas the observations are the results of both the forced component and an unforced component (i.e. "weather noise"). So even if the models project the forced component perfectly, the projection will still be expected to differ from the observations. In 1988, Hansen didn't have the computing power to also estimate the error bars on the projections, but assessment of model skill still needs to be dependent on the inherent uncertainties. My question is intended to determine whether your expectations of the projections are reasonable, and on what basis you decide whether a projection is good or bad.
    0 0
  50. "... Climate sensitivity has fallen from ≈ 4.2°C to ≈ 2.1-2.7°C, i.e., it has fallen to 50-64% of Hansen's 1988 estimates. The above errors do not represent pretty good estimates. They are actually pretty bad and I look forward to SkS's defence of these bad results." But no one is defending 4.2C as being an accurate figure for sensitivity, so what's your point? In addition, to quote from another SkS article: "Hansen's model correctly projected amplified warming in the Arctic, as well as hot spots in northern and southern Africa, west Antarctica, more pronounced warming over the land masses of the northern hemisphere, etc. The spatial distribution of the warming is very close to his projections." So given a reasonable value for sensitivity, spatial distribution and the overall trend would've been very good. The model was and is remarkably sound for having been published in 1988. It strengthens the argument that sensitivity is around 3C (his model did not account for the decade-long solar minimum we've just experienced, either, doing so would lead to a higher sensitivity than 2.7C showing a much better fit than did 4.2C).
    0 0

1  2  Next

You need to be logged in to post a comment. Login via the left margin or if you're new, register here.


The Consensus Project Website

THE ESCALATOR

(free to republish)


© Copyright 2024 John Cook
Home | Translations | About Us | Privacy | Contact Us