Have American Thinker disproven global warming?
Posted on 22 February 2010 by John Cook
American Thinker have published an article The AGW Smoking Gun by Gary Thompson who claims to disprove a key component of anthropogenic global warming. The article begins by stating "...it seems that the only way to disprove the AGW hypothesis is to address problems with the science". This is a fair statement and a return to an emphasis on science in the climate debate is most welcome. So have American Thinker discovered a flaw in climate science that has escaped the attention of the world's climate scientists? Let's examine Thompson's article to find out.
Thompson looks at several peer-reviewed analyses examining satellite measurements of outgoing longwave radiation. As greenhouse gases increase in the atmosphere, they should trap more outgoing longwave radiation. This leads to a build-up of heat in our climate. It also means less longwave radiation escaping to space. The idea is explored in An observationally based energy balance for the Earth since 1950 (Murphy 2009) . Imagine this simplified thought experiment. The earth is in energy balance - incoming sunlight equals Outgoing Longwave Radiation (OLR). There's a sudden increase in CO2. OLR suddenly drops and the planet is in positive energy imbalance. The planet accumulates heat. A hotter object radiates more energy so OLR increases. Eventually OLR increases to the point where it again matches incoming sunlight and the planet is in equilibrium.
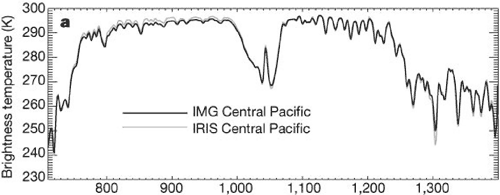
Thompson looks at the several papers that compare satellite measurements from the 1970s to 1996 and later. The first paper that performed this analysis was Harries 2001. Thompson posts a graph from that paper that compares outgoing longwave radiation over the central Pacific from the 1970s to 1996. The black line is the outgoing longwave spectrum in 1970. The grey line is the outgoing spectrum in 1996.

Figure 1: Observed IRIS and IMG clear sky brightness temperature spectra for the central Pacific (Harries 2001).
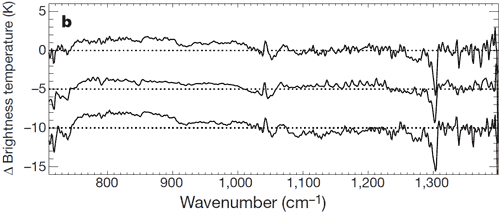
Thompson concludes "After analyzing this graph, the following conclusion can be drawn: The 1997 OLR associated with CO2 is identical to that in 1970". By "analyzing this graph", he presumably means eyeballing the graph as he provides no actual data analysis. This is a shame because in Harries 2001 directly below this graph is data analysis of the calculated difference between the IMG and IRIS satellite data as well as a comparison with modelled results. What do models predict will happen with rising greenhouse gases? Less longwave radiation will escape at the absorptive wavelengths of greenhouse gases such as carbon dioxide and methane. As the atmosphere warms, it will emit more radiation over the whole longwave spectrum. So we expect to see an increase in outgoing radiation over some of the longwave spectrum with sharp drops at certain wavelengths. This is indeed what is observed, consistent with model simulations.

Figure 2: Observed difference between 1970 to 1996 over the central Pacific (top). Simulated difference over the central Pacific (middle). Observed difference for 'near-global' - 60°N to 60°S (bottom) (Harries 2001).
The top curve in Figure 2 is the observed difference between 1970 and 1996 over the central Pacific. This shows strong agreement with the middle curve which is the modelled results. The bottom curve is the observed difference for a near-global area. Observations are consistent with our theoretical expectations of how the greenhouse effect should behave. The close match between observation and simulation lead the paper's authors to conclude "Our results provide direct experimental evidence for a significant increase in the Earth's greenhouse effect that is consistent with concerns over radiative forcing of climate". One wonders how Gary Thompson missed this conclusion as it's stated both in the paper's abstract and in the concluding paragraph.
There is much else that can be gleaned from Figure 2. Interestingly, the near-global observations show a greater drop in outgoing longwave radiation at the CO2 wavelengths around 700 cm-1 compared to the change over tropical regions. Does this indicate the change in greenhouse effect is greater at higher latitudes? It's also worth noting that the data doesn't cover the entire longwave spectrum as CO2 absorption below 700 cm-1 is not shown.
So what do we learn from the American Thinker article. Thompson cites peer-reviewed papers but his analysis consists of eyeballing graphs while spurning the peer-reviewed data analysis. This approach leads to the opposite conclusion of the papers' authors. I first encountered Harries 2001 when documenting the empirical evidence for an enhanced greenhouse effect. After reading the paper, I had many questions. Rather than let the gaps in my understanding lead me to think I knew more than the authors, I emailed my questions to the lead author John Harries, an approachable scientist who was forthcoming with prompt and detailed replies. The American Thinker article does not disprove the enhanced greenhouse effect. It does however provide further evidence for the Dunning-Kruger effect.


 Arguments


JC: I was curious as to why the comparisons of spectra only went down to 700cm-1 when the IMG data went down to 600cm-1. It seems there would be more CO2 absorption at lower wavelengths.
JH: The signal to noise ratio below 700 cm-1 decreased rapidly, so the quality of the spectra below this point was not good. The error bars became larger than the expected differences, so this region was not used.
JC: How did you work out the difference between the IMG to IRIS data?
JH: For the observations, measurements from both the IRIS and IMG instruments are available. These were calibrated radiometrically by the scientific teams that carried out each project. We had to process the data so that the spectral resolution was the same (choosing the resolution of the lower resolving instrument - IRIS), and we tested that the data processing in each case had not introduced artificial differences (apodisation function, field of view), and that the spectral scales were equalised (comparison of spectral wavenumber of individual features). Once all these effects had been taken into account, so that the two spectra were directly comparable, we took the difference to produce Figs 1a and 1c. For the theoretical curve (Fig 1b), we have programs that can simulate the upwelling spectrum at the top of the atmospehre, if the state of the atmosphere below is defined. We have data for the atmosphere for both periods, for the location chosen, and so these data were input into the program, and two spectra generated. The difference between these two spectra produces the difference spectrum betwen 1970 and 1997. Note that the theory curve confirms that the shape of the two observed difference spectra in the CO2 band is correct.
JC: I was wondering if your analysis determined whether the total amount of outgoing longwave radiation had decreased from IRS to IMG? If so, is it mentioned in any of your papers (I couldn’t find anything but I may have missed something)?
JH: It's a good question. The problem is that the observations do not cover the whole of the outgoing spectrum, and so it is impossible to obtain a total integral across all wavelengths. The 'missing' part of the spectrum is mainly at lower wavenumbers than about 500 cm-1, where there are effects due to the water vapour feedback.
Even if we could integrate the whole of the outgoing IR, there is still the shortwave (SW) side of the net radiation balance, which we would need to consider to look at the total energy change, in and out.
One other point: to sum up all the energy you would have to use the radiance spectrum, not the brightness temperature spectrum. Though they are equivalent, the transform from one to the other is not linear. So, integrating brightness temperature would not be easy to interpret.
At present, therefore, the spectral measurements are not available to do the integration you suggest, which is why you found no mention in my papers. If you are interested in understanding any changes in the measured incoming and outgoing radiation, the best approach is to use the broad-band (non-spectral) Radiation Budget measurements from instruments such as NASA's CERES.
- Expressing congratulations: comments 1, 2, 12, 15, 18, 20
- Promoting conservative political agenda: comments 2, 4, 7, 8, 10, 11, 12, 14, 17
- Attack on scientists: comments 3, 5, 7, 9, 10, 13
- Statement that AGW is a hoax/fraud/scam: comments 10, 11, 13, 14, 17
- References to Al Gore: comments 7, 11
- Praise for Lindzen or other prominent "skeptics": comments 9, 10, 15
- Linkage to other climate-"skeptic" issues: 13 (snow this winter), 18 (claims of ice age in 1970s), 19 (Medieval Warm Period, hockey stick, etc.)
- Linkage to other issues: comments 10, 17 (both advocating use of DDT as a pesticide)
In other words, there's a complete absence of skepticism over there. Indeed, there's little more than self-congratulatory backslapping, repetition of widely available "talking points," and a tendency to see everything in the light of a particular current US conservative political agenda. Whatever your position on AGW is, one should at least acknowledge that John Cook has done an admirable job of creating a site here where science is discussed openly and critically, and where politics and personal attacks are mostly left outside.I'm not sure that the authors do put so much value in the simulated graph (eg - Figure 1c from Harries 2001). The main point of their papers is to compare the measured data with the simulation (Figure 1b) to show that our understanding of the enhanced greenhouse effect is confirmed by observations. The use of modelling to filter out the effects of humidity in order to show the isolated effect of trace gases is not a crucial part of the paper (but it is interesting).
I'm not optimistic that we'll see the analysis extended to 600 cm-1 as that is limited by the 1970s satellite data.
Anyway, I appreciate your comments and expect (nay demand) that commenters here will abide by our commenting policy and treat you with respect.