Working out climate sensitivity
Posted on 23 October 2009 by John Cook
In the last post on past climate change, we looked at just two determinations of climate sensitivity. I started with Hansen 1993 as it used a relatively simple methodology in using temperature change and radiative forcing to calculate climate sensitivity. Hegerl 2006 was chosen because it covered the most famous of past climate change periods - the Medieval Warming Period and Little Ice Age. But to be fair (and consistent with my 'whole picture, not a single piece of the puzzle' philosophy), you get a clearer idea of our understanding of climate sensitivity by perusing the whole range of peer reviewed scientific literature on the subject.
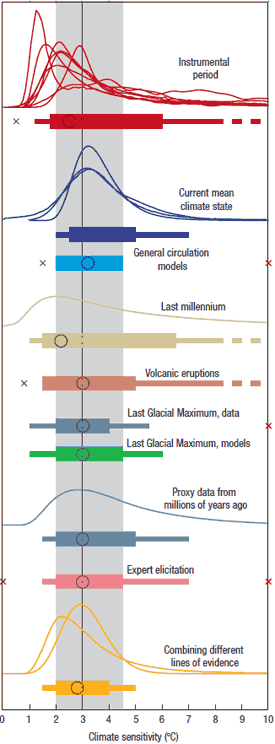
The equilibrium sensitivity of the Earth’s temperature to radiation changes (Knutti & Hegerl 2008) presents a comprehensive, concise overview of our scientific understanding of climate sensitivity (H/T to Things Break for the heads up). In particular, it presents a visual summary that very neatly encapsulates how various methods examining different time periods have yielded consistent results (and I'm not just saying that because it uses lots of bright, shiny colours).
 Figure 1: Distributions and ranges for climate sensitivity from different lines of evidence. The circle indicates the most likely value. The thin coloured bars indicate very likely value (more than 90% probability). The thicker coloured bars indicate likely values (more than 66% probability). Dashed lines indicate no robust constraint on an upper bound. The IPCC likely range (2 to 4.5°C) and most likely value (3°C) are indicated by the vertical grey bar and black line, respectively.
There have been many estimates of climate sensitivity based on the instrumental record (eg - the past 150 years). Several studies used the observed surface and ocean warming over the twentieth century and an estimate of the radiative forcing. A variety of methods have been employed - simple or intermediate-complexity models, statistical model or energy balance calculations. Satellite data for the radiation budget has also been analysed to infer climate sensitivity.
Some recent analyses have used the well-observed forcing and response to major volcanic eruptions during the twentieth century. A few studies examined palaeoclimate reconstructions from the past millennium to gain insight into climate sensitivity. Direct estimates of the equilibrium sensitivity from forcing between the Maunder Minimum period of low solar forcing and the present are also broadly consistent with other estimates.
What can we conclude from this? We have a number of independent studies covering a range of periods, studying different aspects of climate and employing various methods of analysis. They all yield a broadly consistent range of climate sensitivity with a most likely value of 3°C for a doubling of CO2. When I say doubled CO2, what is meant specifically is a radiative forcing of 3.7 Wm-2. A variety of forcings will have actually influenced climate over the periods examined, not just CO2.
So the combined evidence indicates that the net feedback to radiative forcing is significantly positive. Knutti concludes there is no credible line of evidence that yields very high or very low climate sensitivity as a best estimate. However, there is still some uncertainty about the exact value of climate sensitivity with a likely range (more than 66% probability) of 2 to 4.5°C.
There is more certainty regarding the lower bound of climate sensitivity. The probability of lower climate sensitivity drops off sharply while it's harder to rule out larger climate sensitivities. This is the inevitable consequence of a climate system with positive feedback. Constraints from observed recent climate change indicate that climate sensitivity is very likely (more than 90% probability) to be larger than 1.5 °C.
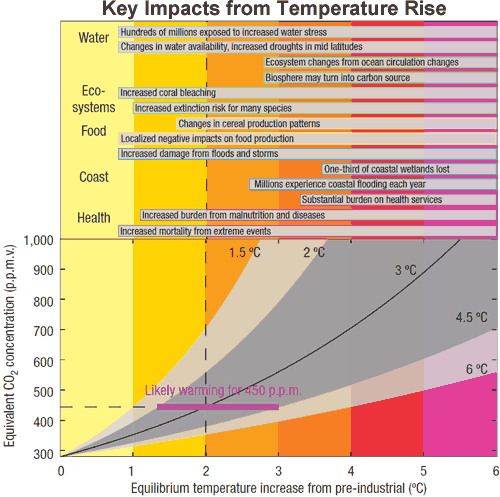
Where the rubber hits the road in all this analysis is how future temperature rise will affect humanity. Figure 2 shows temperature rise for a given CO2 level. The dark grey area indicates the climate sensitivity likely range of 2 to 4.5°C.

Figure 2: Relation between atmospheric CO2 concentration and key impacts associated with equilibrium global temperature increase. The most likely warming is indicated for climate sensitivity 3°C (black solid). The likely range (dark grey) is for the climate sensitivity range 2 to 4.5°C. Selected key impacts (some delayed) for several sectors and different temperatures are indicated in the top part of the figure.
If we manage to stabilise CO2 levels at 450ppm (current value 384ppm), we have a probability of less than 50% of meeting the 2°C target. The key impacts associated with 2°C warming can be seen at the top of Figure 2. The tight constraint on the lower limit of climate sensitivity indicates we're looking down the barrel of significant warming in future decades.


 Arguments


- Despite the many determinations of climate sensitivity, there hasn't been much progress in constraining the likely values - it's gone from initial estimates of 2 to 4°C to current estimates of 2 to 4.5°C. You call that progress?! A large part of this is uncertainties associated with radiative forcings, as you point out.
- At least there has been progress in constraining the lower bound being very likely greater than 1.5°C. Anything over 1.2°C. indicates the climate has net positive feedback.
It's interesting you should mention the uncertainty with radiative forcing in relation to CO2 forcing - I will be posting on that very subject in the next post.Re the sun irradiance papers, I'm fairly confident they would be included in the 'Instrumental Period' results but feel free to check this out yourself (and report back please). We examine elsewhere the role of the warming sun in the early 20th century.