Climate Science Glossary

Term Lookup

Enter a term in the search box to find its definition.

Settings

Use the controls in the far right panel to increase or decrease the number of terms automatically displayed (or to completely turn that feature off).

Term Lookup

Settings


All IPCC definitions taken from Climate Change 2007: The Physical Science Basis. Working Group I Contribution to the Fourth Assessment Report of the Intergovernmental Panel on Climate Change, Annex I, Glossary, pp. 941-954. Cambridge University Press.

Home Arguments Software Resources Comments The Consensus Project Translations About Support

Bluesky Facebook LinkedIn Mastodon MeWe

Twitter YouTube RSS Posts RSS Comments Email Subscribe


Climate's changed before
It's the sun
It's not bad
There is no consensus
It's cooling
Models are unreliable
Temp record is unreliable
Animals and plants can adapt
It hasn't warmed since 1998
Antarctica is gaining ice
View All Arguments...


Username
Password
New? Register here
Forgot your password?

Latest Posts

Archives

Global cooling - Is global warming still happening?

What the science says...

Select a level... Basic Intermediate

All the indicators show that global warming is still happening.

Climate Myth...

It's cooling

"In fact global warming has stopped and a cooling is beginning. No climate model has predicted a cooling of the Earth – quite the contrary. And this means that the projections of future climate are unreliable." (source: Henrik Svensmark)

At a glance

Earth's surface, oceans and atmosphere are all warming due to our greenhouse gas emissions, but at different rates. Some places are also warming much faster than others: parts of the Arctic for example. That variability is partly because other phenomena act to offset or enhance warming at times. A good example are the effects of La Nina and El Nino, an irregular variation in winds and sea surface temperatures over the tropical eastern Pacific Ocean that can influence temperatures and rainfall patterns right around the world.

El Nino causes even warmer years whereas La Nina tends to peg temperatures back to an extent. Thus 2023 – an El Nino year - was the warmest year on record, according to the USA-based National Oceanic and Atmospheric Administration, but other recent years have not been far behind – 2016 and 2019 are in second and third place respectively. The worrying thing is that 2019 only saw a mild El Nino. And even with a La Nina featuring, 2021 and 2022 were, respectively, still the seventh and sixth hottest years on record.

The year 1998 featured a massive El Nino and consequent temperature spike that was a strong outlier, well above the steady upward trend. That spike and the subsequent return to a more “normal” warming pattern led to claims in the popular media that global warming had “paused” or had even stopped. This was a typical misinformation tactic that, as usual, time has proved wrong. As things currently stand, the top ten warmest years have all been since 2010 and 1998 is nowhere to be seen any more. By modern standards, it simply wasn't warm enough.

Please use this form to provide feedback about this new "At a glance" section. Read a more technical version below or dig deeper via the tabs above!


Further details

In the years following 1998, at the time the hottest year on record, there was a concerted misinformation campaign to convince the public that global warming had variously slowed down, stopped or even that we were entering a period of cooling. Of course, we now know that such claims were nowhere near correct. In today's top ten ranking of warmest years, the year 1998 is nowhere to be seen. It simply wasn't warm enough. So let's take a look at how the claims came about, because they reveal insights into the methodology of those who design and spread misinformation.

The entire planet continues to accumulate heat due to the energy imbalance created through our greenhouse gas emissions. Earth's atmosphere is warming. Oceans are accumulating energy. Land absorbs energy and ice absorbs heat to melt. Year to year ups and downs in these things are simply noise, reflecting variations in how that heat is moved around the planet and what other influences are at work, such as the irregular El Nino Southern Oscillation (ENSO) that can nudge the global temperature one way or another by up to 0.3C. That's why 1998 was such a warm outlier: it coincided with a very strong El Nino. El Nino conditions always warm things up whereas La Nina conditions cool things down (figure 1).
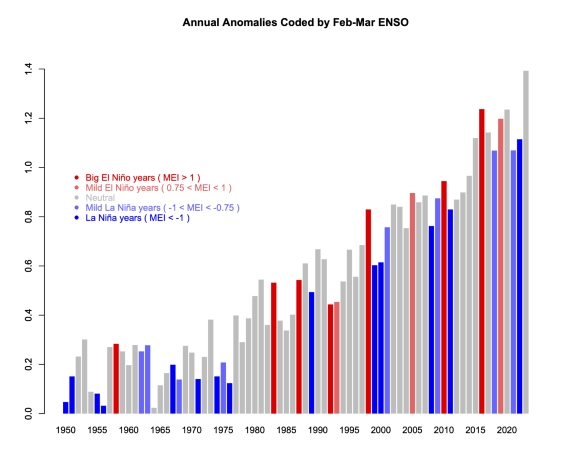
GISTEMP-ENSO-coded-plot from RealClimate

Figure 1: GISTEMP anomalies to end-2023 (with respect to late 19th Century), coded for ENSO state in the early spring - red is El Nino, blue La Nina. 2023 is in grey because that El Nino did not develop until later in the year. Graphic courtesy of Realclimate.

Climatologists routinely use multi-decadal blocks of time when presenting temperature trends for a very good reason. Such blocks allow you to stand back and look at the bigger picture. Due to the noise, taking a much shorter time-span – say just five or ten years – allows you to say anything you like about trends, depending on the particular block you pick.

For example, if you picked a short run of 5-10 years ending in 1998, you could have – if you were so inclined – said, “look how fast it's warming!” Likewise, taking a number of years starting with 1998, you could have made the equally invalid claim that global warming had stopped. And of course, that claim was made, vociferously, in the early-mid 2000s. It was a classic example of cherry-picking: the manifestly unscientific practice of choosing the data that supports the argument one is paid to make on behalf of those who sponsor misinformation campaigns. Once you know about such tricks, you can challenge them yourself. You can ask someone why they showed such a short temperature record when showing a much longer one is the normal practice.

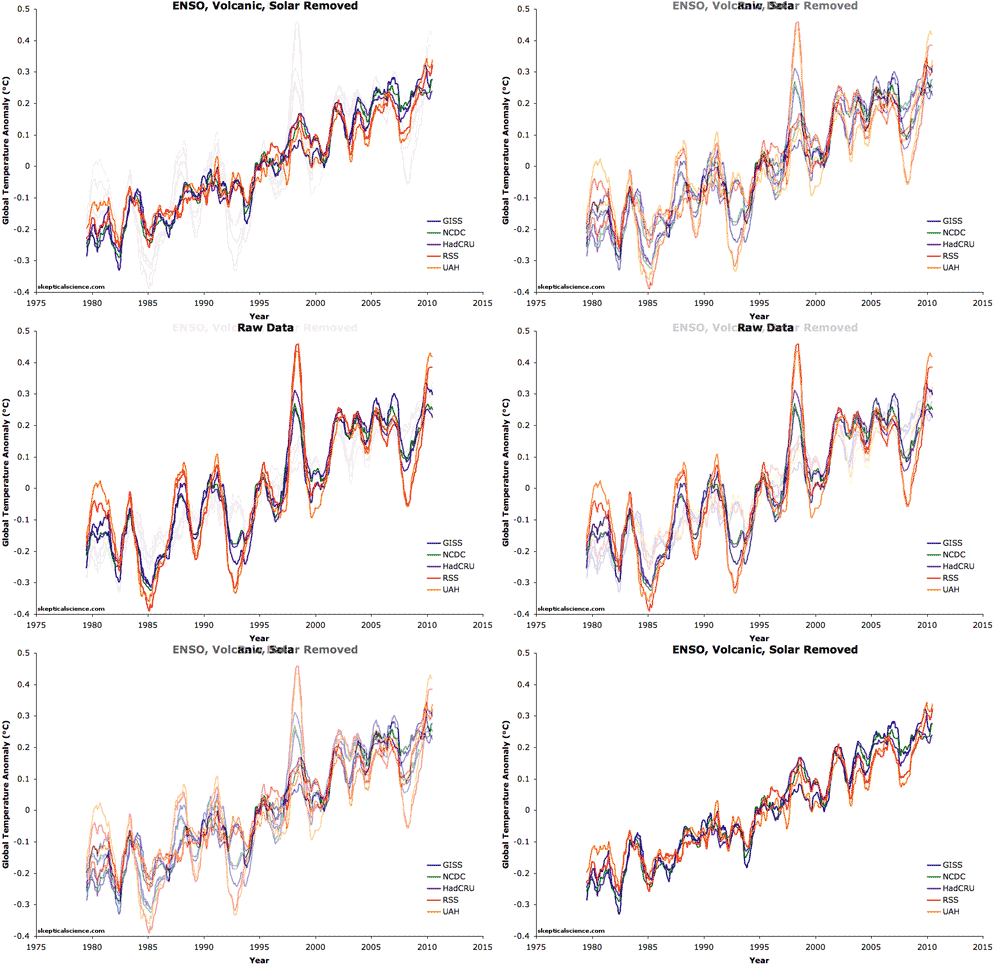
It is difficult but technically possible to filter out the noise described above from temperature datasets. In the paper Foster and Rahmstorf (2011) the authors used the statistical technique of multiple linear regression to filter out the effects of ENSO, solar and volcanic activity (Figure 2). They found that the underlying global surface and lower atmosphere warming trends have in fact remained steady in recent years. There's still noise in there but nowhere near as much. We were still warming all along.

before/after filtering

Figure 2: Five datasets of global surface temperature and lower troposphere temperature are shown before and after removing the short-term effects of the El Niño Southern Oscillation (ENSO), solar variability, and volcanic aerosols.  A 12-month running average was applied to each dataset.

Last updated on 4 June 2024 by John Mason. View Archives

Printable Version  |  Offline PDF Version  |  Link to this page

Argument Feedback

Please use this form to let us know about suggested updates to this rebuttal.

Related Arguments

Further reading

Update

On 21 January 2012, 'the skeptic argument' was revised to correct a minor formatting error.

Denial101x video

Here is a related video lecture from Denial101x - Making sense of climate science denial

Comments

Prev  1  2  3  4  5  6  7  8  9  10  11  12  13  14  Next

Comments 76 to 100 out of 338:

  1. Yooper, I agree with pretty much every point you make @ 74, but it is a strawman argument. To rebut me you would need to show how historic temp data encompasses the total Earth heat content. That is what this page is talking about and that is what my post was about. Nitpicking about what years of temp data the NAS has confidence in has nothing to do with my point that historical temp data doesn't encompass total Earth heat content.
  2. To the Yooper, Thanks for the links above, re #65, excellent way to get a good base, very interesting info. I have some questions that I will post in the appropriate threads.
  3. I'm one of those idiot skeptics. No matter how hard I try to become alarmed about the warming earth--I simply can't. Yes, it looks like we're warming but it appears I am too dumb to understand the charts behind the charts and know the numbers behind the numbers. Naive me, I just looked up facts and figures a few years ago to see what was happening--yikes--the earth HAD NOT BEEN HEATING up, despite what alarmists said. What was everyone talking about? Then 2005, 2008, and now 2010 show some heat and gives the alarmists tingles up and down their leg...I read the reports from NASA, they wrote, "It now seems pretty certain 2010 will outpace 1998, which currently ties for fourth hottest year in the NASA dataset." So I looked at their chart. I feel left out becasue it doesn't give me tingles. There is a record high March....uh... your point is? No other months seem remarkable. So one month spikes the charts and the stats and the global warming "trend" is intact. June, July, and August were cooler than the other comparison years. So in order to try and make this look serious NASA writes: "Continuing the trend from the previous month, NOAA reports that May, the period from March to May, and from January to May all have had the hottest combined global land and ocean surface temperatures since records began in 1880. " I read the chart from NASA--they have to use the word "combined" and "since 1880" to make the stats look scary. March was the only scary month of this year, if global warming scares you. Just last week SeaTac recorded the coldest temp ever recorded for this month at the airport. Ohhh-maybe if I combine it with some other cold records I can manipulate the stats to refute NASA? But i don't take the cooling alarmists that seriously either. Geologist Dr. Don Easterbrook's projected cooling for the next several decades and is based on past PDO patterns for the past century and temperature patterns for the past 500 years. Three possible scenarios are shown: (1) global cooling similar to the global cooling of 1945 to 1977, (2) global cooling similar to the cool period from 1880 to 1915, and (3) global cooling similar to the Dalton Minimum from 1790 to 1820. At this point, I don't believe any of you--not Dr. Easterbrook--not the bots at the bottom of the sea not NASA and NOAA-- Until Greenland has the green meadows and longer growing season it enjoyed in the 1400's I won't buy into the "warming" craze--and if it happens I will be happy for the planet because those warmer periods bring a cornucopia of plenty to the earth and its people (polar bears survived that period just fine). and if the glaciers return with a vengeance, I will be happy becasue it will make it harder for man to survive and that is how we advance--by overcoming adversity. On a final note: Dear Esop, you wrote, "Nature is turning all the natural drivers to Max Cool and September was still the warmest by far." Did you look at the charts by NASA? Sept was hotter than 1998, yes, but cooler than 2005 and a number of other years. and this June, July and August were cooler than all the comparison years. But like I said, I can't understand the secret numbers behind the numbers, and charts behind the charts and I am certainly way too simple to understand the cycles of nature and cooling and warming. I just read history and take the numbers at face value--how dumb is that?
  4. Re: daybyday (78) I well understand the feeling of skepticism when new to climate science - I've been there. But you offer conflicting testimony: 1. On one hand you confess basically "not getting it" and that there must be "secret numbers behind the numbers" (Psst: there are no secret numbers...don't tell anyone! It's a secret!). 2. On the other hand, you say "At this point, I don't believe any of you". Which leads me to ask: Which is it? Number one or number two? If it's number one and you want to learn the truth, then click on the home link in the upper left corner, then on either/both of the "Newcomers, Start Here" and/or "the Big Picture" links in the blue boxes near the top. If it's number two or you just don't want to learn, then why are you here? "Pour the coins of your pocket into your mind and your mind will line your pockets with gold" The Yooper
  5. daybyday wrote : "Naive me, I just looked up facts and figures a few years ago to see what was happening--yikes--the earth HAD NOT BEEN HEATING up, despite what alarmists said." Not been warming up ? Since when ? What were the "facts and figures" you looked up ? Can you give more detail ? daybyday wrote : "I feel left out becasue it doesn't give me tingles. There is a record high March....uh... your point is? No other months seem remarkable. So one month spikes the charts and the stats and the global warming "trend" is intact. June, July, and August were cooler than the other comparison years. So in order to try and make this look serious NASA writes: "Continuing the trend from the previous month, NOAA reports that May, the period from March to May, and from January to May all have had the hottest combined global land and ocean surface temperatures since records began in 1880. " I read the chart from NASA--they have to use the word "combined" and "since 1880" to make the stats look scary. March was the only scary month of this year, if global warming scares you. Just last week SeaTac recorded the coldest temp ever recorded for this month at the airport." Are you just looking at the data for individual months and determining a trend from that ? Not good. A month, while more interesting than a week, day, hour, etc. is too short a time period to be comparing temperature data if you want to make assertions of any value. A collection of months is better; a number of years is better; 30 years is even better. The reason why months are "combined" is because they eventually add up to a year - combine years and you get a decade, etc. The more the better. The reason why NASA mention 1880 is because 1880 is the year their temperature records start from. Nothing to do with scaring anyone. If their records started in 1780, they would then say 'since 1780'. Simple as that. You should also notice that the temperature trend has been up since that time. Here is their latest monthly statement : For January–October 2010, the global combined land and ocean surface temperature was 0.63°C (1.13°F) above the 20th century average of 14.1°C (57.4°F) and tied with 1998 as the warmest January–October period on record. That's why it is also worthless to highlight records for any particular spot on the planet. Records are always being set in individual places but, as in the way you highlighted months above, it is more relevant to look at records which encompass more than one place, state, country, region, etc., and records which follow a pattern, rather than being one-offs, etc.
  6. daybyday wrote : "Geologist Dr. Don Easterbrook's projected cooling for the next several decades and is based on past PDO patterns for the past century and temperature patterns for the past 500 years." What expertise do you believe that this geologist has that makes him relevant to your opinion ? I believe he stated it would be cooling by now - compare that with the NASA data above, and you might be interested in this review of his work. daybyday wrote : "Until Greenland has the green meadows and longer growing season it enjoyed in the 1400's I won't buy into the "warming" craze--and if it happens I will be happy for the planet because those warmer periods bring a cornucopia of plenty to the earth and its people (polar bears survived that period just fine). and if the glaciers return with a vengeance, I will be happy becasue it will make it harder for man to survive and that is how we advance--by overcoming adversity." Do you have any evidence for those "green meadows" and that "longer growing season" ? You should read further on this website, particularly : Positives and negatives of global warming Greenland used to be green PDO daybyday wrote : "But like I said, I can't understand the secret numbers behind the numbers, and charts behind the charts and I am certainly way too simple to understand the cycles of nature and cooling and warming. I just read history and take the numbers at face value--how dumb is that?" There are no secrets but you do need to know how to look at the data, how to use it and how not to use it. It is also best if you avoid some of the more dodgy AGW denial sites out there, and check anything that you use in your posts, to make sure that you are posting information that can be backed-up or confirmed, especially by yourself.
  7. Yup, still happening: NASA: Hottest November on record, 2010 likely hottest year on record globally — despite deepest solar minimum in a century And the zonal means plot showing the polar amplification: Zonal Means Plot for November 2010 Don't know about you, hoss, but this cowpoke says the heat is on... ...but I still feel significantly lucky! Iris effect, anyone? Bueller? The Yooper
  8. 82: "Iris effect" Good catch, Yooper! Now that's one I hadn't heard of. So off to the google machine: I suppose NASA's Revisiting the iris effect is old hat, but it does offer up a great one line come-back to the pretenses of the cherry-picker: “You cannot make a scientific judgment,” Wong said, “until you’ve done the complete analysis.
  9. If Greenland was covered in meadows in 1400 where did all the run off go? Surely it would have mostly been under water along with many other places!
  10. #84: "covered in meadows" Where have you heard that? If you are referring to the Medieval Warm Period, here is a map that shows Norse settlements of the period; I believe the large white area is ice and snow. And here is a more appropriate thread for further discussion of that subject.
  11. #85 Thanks for the reply. It was from thread 78 above. I should have put it at the start of my bit. Not used to this site yet.
  12. Still Happening (hmmm, just like the Energizer bunny): 2010 was the second-warmest year on record, says the Japanese Meteorological Agency (The ranking is preliminary and is based on the January to November data) (Anyone know if JMA corrects for ENSO?) This other relevant bit caught my eye:
    "The average temperature over land is expected to hit the warmest record."
    See JMA press release here. It's like Deja Vu all over again... The Yooper
  13. In a recent debate I had with someone they offered this: "I would like to comment on Global Warming. Makes me smile when I hear Global warmer’s these days dismissing the third year of record cold temperatures as, “Just weather” and the big picture is what really counts! They are of course exactly correct in saying this, it’s what reasonable people have been saying all along, but rest assured that global warmers have been forced into the position they find themselves in. Before the record cold set in every story concerning a shortage of rainfall, lack of snow on the Iditarod trail, a heat wave anywhere, etc, etc, was all linked to the rapped and unstoppable effects of man made global warming. Before the cooling trend every story that could possibly be linked to the immediate affects of AGW, was. The fact is that the world is not warming, everyone knows this, it’s obvious AND it’s proven but let us be extremely generous in this Christmas season and say, for the sake of argument, that yes man kind’s production of CO2 gas can heat the earth. Then we would have to say at this point that there are other factors also affecting the earth’s temperature and that very likely CO2 gas is a minor factor easily made insignificant by the natural forces of nature." What do you make of that?
  14. @Chris: "What do you make of that?" Uh...that it's utter nonsense? Number of facts the person got wrong: 1) We are *not* in a cooling trend 2) There have been more record hot temperatures than record cold temperatures 3) There is a difference between science and how the media reports it: compounding the two is an illogical thing to do 4) Global Warming doesn't mean it's going to get warmer everywhere all the time 5) It is neither proven nor obvious that the world isn't warming 6) Other long-term factors are not currently affecting climate to a greater degree than CO2 This person you were talking to bases its entire argument on faulty assumptions and outright falsehoods.
  15. @archiesteel: I passed on your response to the person I'm talking to and this was his response: "Recently, 130 German scientists wrote an open letter to their government. They made the following points: 1.Information known before the IPCC was founded shows that human CO2 emissions have no measurable effect on global warming. 2.The atmosphere has not warmed in the last 10 years and has cooled significantly since 2003. 3. The expensive IPCC climate models predicted steady warming but the opposite has occurred. 4. Growing evidence continues to show human CO2 plays no measurable role in climate change. 5. If all fossil fuels were burned, the additional long-term warming would not exceed a few tenths of a degree. 6.The IPCC has been aware of this fact but has completely ignored it. 7. As a result, the IPCC has lost its scientific credibility. 8. The belief in manmade climate change has become a pseudo-religion. 9. The Second International Conference on Climate Change in NY March 2009 was attended by approximately 800 leading scientists, some of whom are among the world’s best climatologists. 10. The media has virtually ignored the results of this Conference. " You can read the entire open letter here: http://climatephysics.com/2010/09/19/open-letter-to-the-chancellor-of-germany-by-130-scientists/
  16. Chris, You can investigate each of these claims on this site's own List of Skeptic Arguments. There is also a good index of common claims here. Be warned that your discussion with this person is likely to devolve into an endless Gish Gallop. It is the argument style of choice for those who have no interest in understanding what they are discussing, but have formed a conclusion anyways. If so, you are likely just wasting your time, as he is not really interested in hearing what you have to say. FYI, the Second International Conference on Climate Change is sponsored by the Heartland Institute, a libertarian think tank that is explicitly political in its goals. As such, it is an extremely poor source for objective science. Likewise, the claim that the conference includes "the world's best climatologists" is self-described, and thus should be taken with a very large grain of salt. As for the general credibility of these "130 scientists," the fact that they signed their names to a set of demonstrably false (and quite old) talking points is enough to toss their credibility out the window.
  17. #1: Wholly incorrect. It was intially discovered in the 19th century; Tyndall, Arrhenius, et al. That initial was repeatedly validated in the early-mid 20th century. #2 & 3: Wholly incorrect. Refer to argument #4 & 7, and the recent blog article. #4: Wholly incorrect. Consult the argument list. #5: Wholly incorrect. Strength of belief does not overturn published & independently validated empirical research. #6 & 7: Wholly incorrect. Neither do vast conspiracy notions. #8: Wholly incorrect. Dismissing a empirical field of scientific endeavour as a religion only serves to show pridefully ignorant the respondent is. #9 & 10: The ICCC (1st & 2nd) was a dog & pony show staged by a well-known professional disinformation outfit. Their previous work includes "tobacco is harmless" back in the 90s.
  18. Re: Response to #54TomJones at 01:56 AM on 6 August, 2010 : The source is von Schuckmann 2009:


    Figure 2: Time series of global mean heat storage (0–2000 m), measured in 108 Joules per square metre.
    Hey, you keep digging up this Schuckmann graph, although I have told you it was unbelievable.
          Now I'll give you something to believe. I'm just one hundred and one, five months and a day.'       'I can't believe that!' said Alice.       'Can't you?' the Queen said in a pitying tone. 'Try again: draw a long breath, and shut your eyes.'       Alice laughed. 'There's no use trying,' she said 'one can't believe impossible things.'       'I daresay you haven't had much practice,' said the Queen. 'When I was your age, I always did it for half-an-hour a day. Why, sometimes I've believed as many as six impossible things before breakfast.
    Some more practice is needed perhaps. That way one could eventually believe between december 2006 & february 2007 OHC went up by 8.15×10⁷ J/m2. That's about 3×10²² Joules in just two months, about 25% of its supposed increase in 55 years (since 1955).
  19. @Chris: Bibliovermis pretty much said it all. Your friend believes things that are false, and bases all of his argument these falsehoods. His response is therefore insufficient. This is how you can respond, if you want to (it seems as if he is politically opposed to AGW theory, and as such is unlikely to be open to a rational scientific argument): 1. The greenhouse effect was discovered in th 19th century and has been validated numerous time since. The burden of scientific proof is therefore on those claiming it doesn't exist. 2. That position is wrong on two counts, i.e. that 7 or even 10 years is a sufficient period to establish statistical relevance, AND that temperature have been stable since 2000 or decreasing since 2003. Here is a graph showing the 15, 10 and 7 year trend (again, the last two being statistically not significant to the 95% degree): 3. The IPCC models never predicted steady warming. He has to prove that assertion, or it is irrecievable. 4. As him where that (presumably) peer-reviewed evidence is. Insist on this very simple truth: there is virtually no evidence supporting his position, and a mountain of evidence supporting yours. It's a safe claim to make, as it is completely true (you can find such evidence here). 5. Again, that is an unproved assertion. Ask him for serious peer-reviewed evidence supporting this idea. Remember, the burden of proof is on him, not you. 6. That is an unfounded conspiracy theory. Offer to sell him a tinfoil hat. 7. The IPCC still has the confidence of the scientific community. Most people not trusting the IPCC were already against it, and their opposition is for the most part political. In any case, the IPCC is a reflection of the scientific consensus. Attacking the IPCC is rather meaningless in this regard, as it relies on actual climate science for its position and publications. 8. If anyone is acting in a fanatical manner, it is those who continue to decry AGW theory even after being presented with the strong evidence supporting it. They often repeat the same debunked talking points. In fact, by clearly failing to understand the science while entertaining all kinds of conspiracy theories, they are akin to a modern version of the European medieval flat Earthers. 9. The ICCC was a sham, and very few serious climate scientists attended (if any). It was organized by the Heritage Institute, which is not a scientific body but a highly-politicized conservative think tank. In other words, it is an institution that does not seek to discover the truth, but rather to spread a conservative agenda that unfortunately considers scientific evidence to be less important than political ideology. 10. The media ignored the results of the conference because it was a sham, and an obvious one at that. For a so-called "skeptic," your friend seems to trust what conservatives say about climate change a little too much. Hopefully this is on-topic enough; in any case, I won't add anything to this unless it specifically deals with points 1 to 5.
  20. BP @93, "about 25% of its supposed increase in 55 years (since 1955)" And the 0-2000 m OHC decreased by that about amount in two months in early 2006. Yet, the long-term trend is up my friend. Funny how you ignore that fact. And worse still, I know that you know better BP. Also, please make up your mind. Earlier on this thread you correctly stated that the planet is warming and that TCR is about 2 C, now you seem to be trying to suggest that the warming is an artifact of an alleged faulty data record.
  21. #95 Albatross at 10:43 AM on 30 December, 2010 And the 0-2000 m OHC decreased by that about amount in two months in early 2006. Yet, the long-term trend is up my friend. Funny you don't see it's impossible. One needs a 15 W/m2 radiative imbalance at TOA for two months to produce such wriggles. That's more than 6% of ASR (Absorbed Shortwave Radiation). You could say the Earth was at its perihelion in early 2007. But it makes the drop a year before even more suspicious. Either - or. There's simply no heat reservoir in the climate system other than the oceans that could emit or absorb so much heat. The two events, taken together, require imbalances of some 30 W/m2 on such timescales. Can you see anything like that in the ISCCP-FD Net TOA Radiative Fluxes? An OHC history reconstruction showing impossible features is not the best candidate for estimating trends. Also, please make up your mind. Earlier on this thread you correctly stated that the planet is warming and that TCR is about 2 C I said UAH satellite lower troposphere data showed a (moderate) warming trend. That's not the same as "the planet is warming", is it? And I was not talking about TCR (Transient Climate Response), but equilibrium climate sensitivity and said it was at most 2°C, probably considerably less. Other than that, well done, you've quoted me correctly.
  22. @BP: why does your graph stop in 2005? I'm sorry, but you have yet to make a convincing case against the graph. The fact that results are surprising doesn't mean they are impossible. In fact, considering the limits of the survey (0 to 2000 meters), it is quite possible part of the extra heat was released from below. It seems to me the main reason you are dismissing this graph is that it disagrees with your own (non-peer-reviewed) theories. "I said UAH satellite lower troposphere data showed a (moderate) warming trend. That's not the same as "the planet is warming", is it?" All temperatures show pretty much the same warming trend, and it is not moderate by any reasonable standard. Of course, when your goal is to minimize the risk and stall the debate, everything goes, right?
  23. In any case, the topic of this is "is global warming still happening", and the answer to that is a resounding yes. Discussion of the reliability of an OHC graph are quite off-topic.
  24. Thanks Archiesteel @97, I'm busy today, so I can't argue with BP. Some points. The planet is warming (accumulating heat) the trend in global SATs and tropospheric temperatures is positive and statistically significant, and the rate of warming is noteworthy. Sad that BP cannot even conceded that simple point without prefacing the statement with a caveat. BP, despite his claims is not calculating EQS, he is calculating TCR, and his estimate of TCR is within the range of TCR calculated by Gregory and Forster. If BP thinks he is onto something regarding EQS being so low (he does not say exactly how low, lots of arm waving), I am sure Journal of Climate would be happy to ship his manuscript off to the reviewers if they think his proposed method has merit. Yes, the OHC data are problematic. My point though was that despite the spikes and troughs, the trend in those 0-2000 m OHC data between 2003 and 2008 is up. I do not see a systematic positive bias in the measurements. Finally, let us for now forget the SAT data and the OHC data. There are still multiple, independent lines of evidence which point to a warming planet (oddly enough a planet which BP claims is 'cooling itself').
  25. Thanks for the responses Archiesteel & Bipliovermis. I directed my friend to this thread and this was his response: "Well, I followed the link you provided to the Skeptical Science site and I read what they had to say about the assertion that the earth is in a current cooling trend. I really don’t see what you see in the site? I provided you with a long list of scientists who are in agreement that the earth is cooling and skeptical science writes: “Whilst it’s natural to start with air temperatures, a more thorough examination should be as inclusive as possible; snow cover, ice melt, air temperatures over land and sea, even the sea temperatures themselves.” Yes … they thought of that! In fact it was a thorough study of temperatures from the sources listed that brought the list of scientists to the conclusion that the earth is in a cooling trend. This is a good example of the “Straw man” arguments put up by many Global Warmers. The Skeptical Science author implies that people who believe the earth is cooling just haven’t thought of measuring things like ocean temperature. Then he steps in and provides the easy answer to the ravings of the lunatic scientific fringe, “They only look at air temperature! They need to check the oceans!” Ahhh, thank you oh wise one! Of course, anyone who actually looked at the research being conducted by vast numbers of scientists all over the world would understand that their temperature data was amassed from a wide sampling. Also, and I mention this only in passing, anyone who even casually read the emails from the University at East Anglia would know that a major concern that the top Global Warming scientists had (Their research went directly to the U.N.) was that they had no data showing a heating planet and therefore conspired to destroy the data they had. They did in fact destroy and manipulate their data, ultimately resulting in a number of firings. I’m absolutely loving watching Global Warmers explain the current cold snap. The problem, of course, is that Global Warmers had been predicting heat …hence the name, Global “Warming.” So now Global Warmers must emphasize that hey, a few years or even a decade or longer means nothing, what really counts is the long term trend! Here’s how Skeptical Science put it: “For climate change, it is the long term trends that are important; measured over decades or more, and those long term trends show that the globe is still, unfortunately, warming.” Now, go to the site that Chris linked to and drop down to the graph. Click on anything, Ocean heat Content, Sea Surface, etc. (Strangely, no matter what you click on you’re taken to the same story from the government agency NOAA but remember, “There is no political connection between government and Global Warming scientists” …keep repeating that) Look at the title of the NOAA story, See the word “Decade”? Now I don’t see any Global Warmers criticizing the government agency NOAA for irresponsibly reporting how the earth’s temperature increased over a decade when real science looks at the long term picture. Why is this? Why is it that we see Global Warmers jumping up and down and frothing at the mouth to explain away relatively short term cold spells when a simple Google search will reveal that Global Warmers use ANY sort of heating trend from a lake that appears to be drying up to a hot week in November to try and prove their theory that mankind is dooming the planet? Long term trends are indeed all that are important and real scientists know this. Global Warmers, on the other hand, play both sides of the fence. When things are hot, it’s a sign of the coming apocalypse, when it’s cold, it’s just “weather” that really doesn’t mean anything."

Prev  1  2  3  4  5  6  7  8  9  10  11  12  13  14  Next

Post a Comment

Political, off-topic or ad hominem comments will be deleted. Comments Policy...

You need to be logged in to post a comment. Login via the left margin or if you're new, register here.

Link to this page


The Consensus Project Website

THE ESCALATOR

(free to republish)


© Copyright 2024 John Cook
Home | Translations | About Us | Privacy | Contact Us