Climate Science Glossary

Term Lookup

Enter a term in the search box to find its definition.

Settings

Use the controls in the far right panel to increase or decrease the number of terms automatically displayed (or to completely turn that feature off).

Term Lookup

Settings


All IPCC definitions taken from Climate Change 2007: The Physical Science Basis. Working Group I Contribution to the Fourth Assessment Report of the Intergovernmental Panel on Climate Change, Annex I, Glossary, pp. 941-954. Cambridge University Press.

Home Arguments Software Resources Comments The Consensus Project Translations About Support

Bluesky Facebook LinkedIn Mastodon MeWe

Twitter YouTube RSS Posts RSS Comments Email Subscribe


Climate's changed before
It's the sun
It's not bad
There is no consensus
It's cooling
Models are unreliable
Temp record is unreliable
Animals and plants can adapt
It hasn't warmed since 1998
Antarctica is gaining ice
View All Arguments...


Username
Password
New? Register here
Forgot your password?

Latest Posts

Archives

Climate Sensitivity Single Study Syndrome

Posted on 28 January 2013 by dana1981

A press release from a Norwegian project attempting to estimate the Earth's climate sensitivity (generally measured as how much the planet's surface will warm in response to the energy imbalance caused by the increased greenhouse effect from a doubling of atmospheric CO2) has drawn quite a bit of attention in the media as suggesting that global warming may be "less extreme than feared."  Carbon Brief has confirmed that the press release discusses several projects from a Norwegian group, including focusing on a not-yet-published (and not yet accepted by a scientific journal) follow-up paper to Aldrin et al. (2012).  Andrew Revkin has further details.

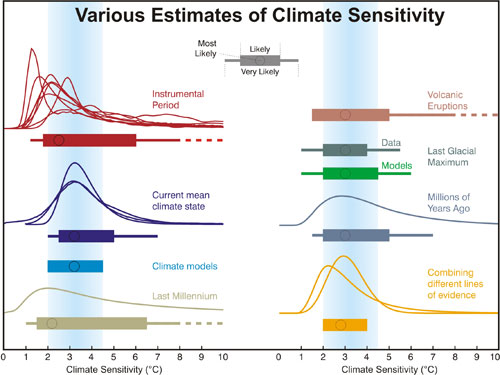
Regardless, there is a large body of scientific research investigating the question of the Earth's climate sensitivity.  Perhaps the most comprehensive review of this research is Knutti and Hegerl (2008), which found that the various methodologies used to estimate climate sensitivity are generally consistent with the range of 2–4.5°C (Figure 1).

Various estimates of climate sensitivity

Figure 1: Distributions and ranges for climate sensitivity from different lines of evidence. The circle indicates the most likely value. The thin colored bars indicate very likely value (more than 90% probability). The thicker colored bars indicate likely values (more than 66% probability). Dashed lines indicate no robust constraint on an upper bound. The IPCC likely range (2 to 4.5°C) is indicated by the vertical light blue bar.  Adapted from Knutti and Hegerl (2008).

Note the wide range of timeframes, data, and methods used in the climate sensitivity studies included in the Knutti and Hegerl review, all of which are broadly consistent with the 2–4.5°C IPCC likely equilibrium sensitivity range.  No single study is going to overturn this consensus of evidence, nor are the Norwegian project's results necessarily inconsistent with the IPCC range.  There is also a question as to exactly what is being estimated – equilibrium sensitivity once the planet reaches a new energy balance (over several decades to centuries), or a more immediate 'transient' climate response.  Regardless, our global warming concerns should not be assuaged by any single study.

Equilibrium Climate Sensitivity vs. Transient Climate Response

A brief presentation of the Norwegian project is available online, and shows that the researchers attempt to calculate the equilibrium climate sensitivity (the total amount of warming when the planet reaches a new energy equilibrium), via the effective climate sensitivity.  This is because the global climate is currently far out of equilibrium due to the energy imbalance caused by the increased greenhouse effect, so it is not possible to calculate the equilibrium sensitivity based on current data.  The IPCC describes effective climate sensitivity as follows.

"The effective climate sensitivity is a measure of the strength of the feedbacks at a particular time and it may vary with forcing history and climate state."

and

"with units and magnitudes directly comparable to the equilibrium sensitivity. The effective sensitivity becomes the equilibrium sensitivity under equilibrium conditions with 2xCO2 forcing."

The effective climate senstivity is measured using snapshots of the climate.  As the Norwegian presentation notes, once the planet reaches energy equilibrium, the effective sensitivity becomes the same as the equilibrium sensitivity.  The two are also the same if climate feedbacks do not change over time – the question remains whether that is true in the real world.  This type of approach may be more strongly related to the "transient climate response" (TCR).

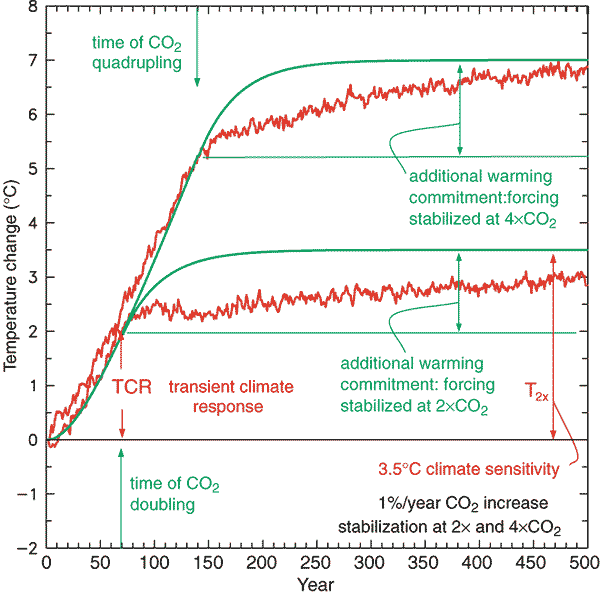
The TCR is basically how much the planet will immediately warm once we reach the level of doubled CO2.  The IPCC puts the TCR very likely above 1°C and below 3°C, with a most likely immediate warming of about 2°C in response to doubled CO2.  Thus we expect roughly two-thirds of equilibrium warming to occur immediately, but the rest of the eventual warming will occur over several decades to centuries (Figure 2).

IPCC TCR

Figure 2: Global mean temperature change for 1%/yr CO2 increase with subsequent stabilisation at 2xCO2 and 4xCO2. The red curves are from a coupled AOGCM simulation (GFDL_R15_a) while the green curves are from a simple illustrative model with no exchange of energy with the deep ocean.  The transient climate response, TCR, is the temperature change at the time of CO2 doubling and the equilibrium climate sensitivity, T2x, is the temperature change after the system has reached a new equilibrium for doubled CO2, i.e., after the additional warming commitment has been realised.  From the 2001 IPCC report.

The effective climate sensitivity calculation is an attempt to bridge the gap between the transient and equilibrium climate responses — in an ideal world equilibrium and effective climate sensitivity are the same.  However, the bigger the global energy imbalance, the more difficult it is to bridge that gap, because the immediate transient response becomes less representative of the ultimate equilbrium response. With a larger change, short-term feedbacks can become less representative of long-term climate feedbacks. 

Another problem can arise if the models overfit short-term noise (natural variability), and there are also significant uncertainties in the overall global energy imbalance and measurements of changes in global heat content, both of which are components of these sensitivity calculations.  Knutti and Hegerl (2008) briefly addresses some of these issues.

"Because few coupled models have been run to equilibrium and the validity of these concepts for high forcings is not well established, care should be taken in extrapolating observationally constrained effective sensitivities or slab model sensitivities to long-term projections for CO2 levels beyond doubling, because feedbacks should be quite different in a substantially warmer climate."

These are a challenges for any study trying to evaluate the equilibrium climate sensitivity based on recent climate data, like this Norwegian study.

The Norwegian Study

There is also a significant red flag in the press release for this study:

"When the researchers at CICERO and the Norwegian Computing Center applied their model and statistics to analyse temperature readings from the air and ocean for the period ending in 2000, they found that climate sensitivity to a doubling of atmospheric CO2 concentration will most likely be 3.7°C, which is somewhat higher than the IPCC prognosis.

But the researchers were surprised when they entered temperatures and other data from the decade 2000-2010 into the model; climate sensitivity was greatly reduced to a “mere” 1.9°C."

Including an extra decade's worth of data into the model should not halve their equilibrium climate sensitivity value, because the equilibrium sensitivity of the climate system is a relatively constant number, and in reality has not changed radically over the past decade.  This suggests that their model may be overfitting the short-term natural variability.

What changed over the past decade?  Probably the largest single effect is that the 1990s were dominated by El Niño events (which cause short-term surface warming) while the 2000s have been domated by La Niña events (which cause short-term surface cooling).  Thus ending their analysis around the year 2000 may have biased their result high, whereas ending the analysis in 2010 could have biased it low.

Another issue is that the study only includes ocean heat content (OHC) data down to a depth of 700 meters.  Over the past few years, heat accumulation in the upper 700 meters has slowed slightly, but it has been offset by faster heat accumulation between 700 and 2000 meters (according to NOAA data, illustrated in Nuccitelli et al. 2012).  But the heat in that slightly deeper layer will not remain there forever; failing to include it may underestimate the equilibrium warming.

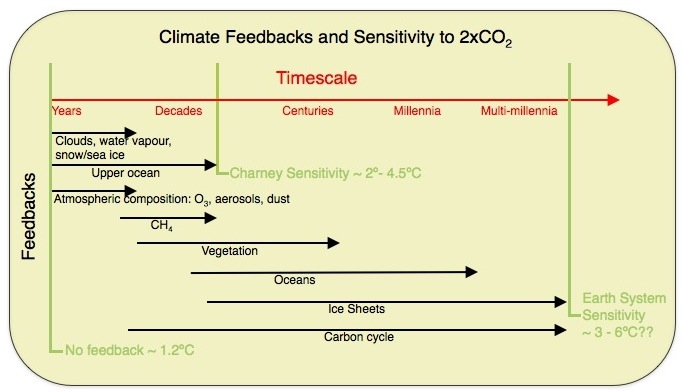
This depends on what timescale the heat exchange between the moderate ocean depths and the surface interact, as illustrated in this graphic showing what's included in measurements of climate sensitivity over different timescales.

sensitivities

Figure 3: Climate feedbacks and timescales included in various sensitivity estimates, via Gavin Schmidt at RealClimate

The difficulty is that OHC data extending to 2000 meters are fairly sparse — the NOAA measurements are basically the only game in town, and only provide pendatal (five-year running average) data.  Nevertheless, neglecting the heat accumulation at these moderate ocean depths could very well lead to a climate sensitivity underestimate.

Reto Knutti has also discussed some of the caveats he sees in general studies of this type in an interview with Andrew Revkin, as well as providing very helpful insight for this blog post.

An Important Aldrin Caveat

One important point regarding the results of Aldrin et al. (2012) is that their main, highly-touted result (climate sensitivity around 2°C) does not include indirect aerosol or cloud effects in their global energy imbalance estimate,

"Therefore, the estimate of [climate sensitivity] presented here is likely to be underestimated because the net forcing of the other indirect effects are likely to be negative."

Aerosols and clouds are two of the least well-constrained contributors to the global energy imbalance, and thus two of the largest sources of uncertainty in climate sensitivity estimates.  When excluding indirect aerosol effects, Aldrin et al. find a sensitivity of 1.2–3.5°C (mean 2.0°C), which increases to 1.2–4.8°C (mean 2.5°C) when including a small indirect aerosol effect.  The number goes even higher when including an estimate for cloud effects.

"Including cloud lifetime effect increases the posterior mean of the climate sensitivity...to a value of about 3.3°C and the uncertainty increases as well"

The Big Sensitivity Picture

Note that the climate sensitivity estimates in Figure 1 based on the instrumental temperature record (the past 100–150 years; in red) tend to fall toward the lower end of the IPCC range, which may be a result of effective sensitivity estimates not fully bridging the gap between transient and equilibrium climate responses, perhaps for some of the reasons discussed here (difficulty accounting for short-term natural variability, moderate-depth ocean heat accumulation, short-term feedbacks not necessarily representative of long-term feedbacks, etc.).

However, no climate sensitivity estimate is perfect.  For example, future conditions (a hot world) will be quite different from conditions during the Last Glacial Maximum (a cold world), and thus different feedbacks may apply in the future than in some of the past analogues used for comparison.

It's also important to always consider the full body of climate sensitivity research.  Anybody can cherrypick a few studies to suggest climate sensitivity is on the low end or on the high end by failing to consider the full body of evidence.  To that end, Gavin Schmidt has also provided a helpful summary of some more recent sensitivity research at RealClimate.

We need to be careful not to fall into the trap of thinking that any single study will overturn a vast body of scientific evidence, derived from many different sources of data (or as Revkin calls this, single-study syndrome).  Regardless, the Norwegian study does not appear to conflict with the IPCC climate sensitivity range.

Ultimately all we can say with confidence is still that equilibrium climate sensitivity likely falls somewhere within the IPCC 2 to 4.5°C sensitivity range.

0 0

Printable Version  |  Link to this page

Comments

Comments 1 to 23:

  1. Thanks for clarifying this Dana-- what a mess. Sadly Revkin's initial report on this and his apparent bias towards lower climate sensitivity papers did not help matters. Fake skeptics also seem to be afflicted with climate model "syndrome". The following comment posted at The Guardian explains it nicely (H/T JohnM): "One other thing: I'm amazed at how many deniers have suddenly found computer models to be accurate, considering how many years they've been telling us they are utterly crap. Don't suppose this epiphany has anything to do with liking the results of some models ("good") while hating the results from others ("bad")." Yet another example of the logical fallacies and contradictory arguments used by fake skeptics and those in denial about AGW. Revkin, should know better than to actively enable this sort of obfuscation. Or is he perhaps trying to deal with his own cognitive dissonance?
    0 0
  2. Goodie. I was hoping that you guys would discuss this one. Little doubt that aerosol emissions, particularly from China, has had a rather significant effect. So the deniers all of a sudden agree with computer models and agree that CO2 causes warming now. Funny. We should get that in writing, as within a few weeks, it will be back to the "CO2 is an insignificant trace gas" chant from that camp.
    0 0
  3. Can confirm that it just was a translation from an earlier post in Norwegian. No new study published... however the group ofc continue to try to publish new research. What that will say, we do not know...
    0 0
  4. Have updated the first paragraph of this post - Carbon Brief confirmed that the study being discussed has not yeet been published, or even accepted by a scientific journal.
    0 0
  5. Thanks Dana. From what I understood their model is just curve fitting without any Physics that constrain their wild speculations. The fact that the so called temperature hiatus since the El Nino years has so much effect on their models predictions is proof of this weakness. It is so predictable that a computer model that affirms the denialists worldview is acceptable but one that does not, that is based on real Physics, is considered a fiction in their Dunning-Kruger minds. It just like modelling the trajectory of a single electron due to unknown influences and predicting its future path without knowing what EM fields were. Let alone where they are at! Bert
    0 0
  6. Bert @5 - I don't think that's accurate. The papers certainly have a physical basis, but they also have limitations, as discussed in this post. I don't think it's fair to call them curve fitting.
    0 0
  7. In the RC link that you provide, there is an interesting discussion (comment 85 and onwards) where statistician Steve Jewson states: "Yes, using a flat prior for climate sensitivity doesn’t make sense at all. Subjective and objective Bayesians disagree on many things, but they would agree on that. The reasons why are repeated in most text books that discuss Bayesian statistics, and have been known for several decades. The impact of using a flat prior will be to shift the distribution to higher values, and increase the mean, median and mode. So quantitative results from any studies that use the flat prior should just be disregarded, and journals should stop publishing any results based on flat priors. Let’s hope the IPCC authors understand all that. Nic (or anyone else)…would you be able to list all the studies that have used flat priors to estimate climate sensitivity, so that people know to avoid them?" Nic Lewis then goes on to cite several papers on CS that use uniform priors to estimate CS.
    0 0
    Moderator Response: [AS] To avoid confusion between AndyS and me, the contributor formerly known as Andy S, I have changed my SkS handle to my full name, Andy Skuce.
  8. For presenting CC to a non expert, and probably hostile audience, I am becoming more appreciative of BEST data since about 1863. Land based transient responses are greater than global because of the moderating effect of 70% ocean on the global record, people live on the land, and it is in the lower 48 U.S.A. that this last year was a record, (Maybe Australia too? Have not looked in detail, but based on some things I have seen in SKS perhaps..)Plus BEST identifies the named historical volcano eruptions and indicates how long they were cooling things. (Something that yet escapes me is where and how one gets a volcano index to regress against.) The deniers will be having a field day with recent results purporting to show small global transient C.S. by regressing against the AMO. I am coming to the tentative conclusion that if one uses the AMO by Van Oldenborgh, rather than the AMO as used by Zhong and Tung, you likely get a larger transient c.s. if you do a regression.
    0 0
  9. #6 dana1981 Perhaps you are right but the Norwegian press release (which is practically what published substance on the issue we have) describes what is classic overfitting. They claim that analysis over the period 1750-2000 gave 3.7K sensitivity, but including 2000-2010 data gave 1.9K. The 1750-2000 period was even outside their upper limit of 2.9. But it is well known that decadal variations occur via phenomenas like ENSO and the period has also been affected by large changes in aerosols forcings in Asia, which I assume is treated as "noise" in their study.
    0 0
  10. curiousd - The AMO is more likely an effect than a cause of temperature changes, as I discussed here. The best fit to global temperatures is with the AMO lagging, not leading, temperatures. And regressing against the AMO (depending on definition, which makes things more challenging) to determine climate sensitivity will likely give an incorrect underestimate - due to subtracting the signal (expressed in the AMO).
    0 0
  11. Dean @9 - I agree the study sounds like it's suffering from overfitting of natural variability, but that's not the same thing as "curve fitting". That's when a bunch of parameters are allowed to vary freely without physical constrataints to make a model fit the data - that's not what the Norwegian group is doing. Their model has a physical basis, they're just not fully accounting for the natural variability in the system (apparently).
    0 0
  12. I haven't read the Norwegian stuff yet, but comments I've made about parameter fitting over here in the "16 more years of Global Warming" thread seem applicable. If you have multiple fitting parameters that are highly correlated, then you can get very similar results with quite different values of the parameters. In such a case, small variations in input data can also lead to large differences in fitted values. I can't say that this is what is happening to the Norwegian work, but it is one of the things I would look for if I were doing such a study.
    0 0
  13. We know from paleo studies that CO2 increases as temperatures rise and this increase came from the natural systems. So we can expect additional natural CO2 as we warm. The Earth will go from a carbon sink, to a carbon source. There are the simple physics chemistry responses such as warm oceans can hold less CO2 and the biospheric responses dying burning trees, phytoplankton losses then there are the biggies melting permafrost and ocean methane clathrates. So if we double CO2, expect nature to add her bit too.
    0 0
  14. My apologies to Andy Skuce for nicking his handle. It wasn't intended
    0 0
    Moderator Response: [AS] No problem, I was going to change it anyway.
  15. To KR at 10, I kind of agree that the AMO could turn out to be the polywater of climate science. I am good with your argument but I think that there is an audience that will respond best to demonstrations that what they are experiencing right now is due to short term effects of C.C. Although it is not a clean regression result yet, I just put in the assumed AMO of Zhong and Tung, smoothed the existing Berkeley Earth data, took data since 1900 to remove Krakatoa, and subtracted from the smooth data ( T c.s. X Log base two CO2 increase + weighting x AMO). Got lowest residual with weighting of AMO 0.4 , T.C.S. of about 1.9. (Whereas a simple linear log fit to unmassaged data as I used to do gives for BEST a transient C.S. of 3). So if I am doing this right, even if you give these folks their AMO, on the land where we live the transient c.s. by itself is large enough to make dilly dallying about mitigation unwise.
    0 0
  16. In addition to Knutti & Hegerl there is this new paper, still in pre-release. A meta study of over 2 dozen other studies, all using Paleo-Climate analyses. Time scales start at 10-20,000 years and stretch out to +400 Myr. The broad conclusion - CS = 3.1 to 3.7.And not a Climate Model in sight.
    0 0
  17. Thanks for this great article! The diagram showing the difference between TCR and equilibrium climate sensitivity is fantastic.
    0 0
  18. Yes, Glenn Tamblyn at 16 above. Great article indeed, and much needed.
    0 0
  19. Dana, Re the difference between effective and equilibrium sensitivity you write: "The two are also the same if climate feedbacks do not change over time" Is that the only difference though? I know that equilibrium sensitivity (and thus the strengths of the feedbacks) depends on temperature, but this dependency is rather weak at the current global temps (it becomes stronger for a much warmer or much colder planet). So why then would feedbacks change significantly over time, if it's not due to a temperature dependence of the sensitivity? I thought that part of the difference may be that while the planet is out of energy balance and the radiative forcing is increasing, that catching up with that imbalance takes time, during which the forcing has again increased, causing yet another build-up of the imbalance. Ie it is an iterative process, and the current ocean heat uptake does not give the full imbalance that we may eventually expect. I'm not sure if I'm on the right track here, since I'm incorporating the future increase in forcing, which may or may not be correct. I haven't come across a good explanation of the difference between effective and equilibrium sensitivity yet; the IPCC definition of the former are not very clear either in my mind. Many authors have in the past assumed them to be the same (eg Schwartz, Ramanathan and Feng). So this seems to be quite a source of confusion. current ocean heat uptake is for some reason not the full measure of the
    0 0
  20. Bart @19 - the concept of effective sensitivity is fairly new to me, and does seem rather unclear even amongst many climate scientists. It seems like the default assumption is to treat it as equivalent to equilibrium sensitivity, as long as sufficiently long timespans of data (~150 years) are analyzed. But if the estimated value can change by 50% just by including another 10 years of data, something is wrong. It may be more of a problem on the measurement side, with deeper ocean heat accumulation being neglected, in combination with uncertainties in the forcing data. So the issue may not be that feedbacks change over time, but rather that measurements of the necessary variables are not sufficiently precise for effective sensitivity calculations to be very accurate. I think that's still an open question, but I would caution against assuming that these effective sensitivity results are accurate estimates of equilibrium sensitivity.
    0 0
  21. Same here: I've cited Ramanathan and Feng's (2009) simple climate diagnosis often, assuming (like they did) that equilibrium sensitivity enters into the calculation of the post-Industrial energy budget. Nic Lewis' estimate (at Bishop Hill) takes the same approach, also assuming it is equilibrium sensitivity he's getting. Problem is that for the past 150 years, no OHC data are available. But still, also for the past 40 years, with the decreased estimate of aerosol forcing in the draft AR5 report, the resulting effective sensitivity would be smaller than it is using a stronger aerosol forcing. There could be a lot of potential explanations for that, but one key aspect which I don't have a good answer to, nor have I found one, is: How much would we expect the effective sensitivity to differ from the equilibrium sensitivity, and why? I think the key must be in the fact that while the system is out of balance and in transition, the ocean heat uptake of the past decades is not necessarily reflecting the extent to which the climate is currently out of balance, because it takes time to warm up and catch up to the current imbalance/forcing. Just thinking out loud here.
    0 0
  22. Yes, sparse OHC data are a challenge. It's interesting that for example when Levitus et al. (2012) came out, climate contrarians were saying the error bars were too small and OHC data are still highly uncertain. Now suddenly they seem to think the uncertainties are inconsequential. In his new 'ten tests' document, Matt Ridley said that aerosols and ocean heat uptake "are now well understood". My jaw nearly hit the floor when I read that. Personally I'm more comfortable with paleoclimate-based sensitivity estimates, the main problem there being that feedbacks in different climate states may not be the same, as I mentioned in this post. And of course there are significant uncertainties in forcing and temperature data further back in time, but the results always seem to be fairly consistent (PALAEOSENS being the latest example).
    0 0
  23. (OffTopic) David B Benson got it correct here. :-)

    0 0

You need to be logged in to post a comment. Login via the left margin or if you're new, register here.


The Consensus Project Website

THE ESCALATOR

(free to republish)


© Copyright 2024 John Cook
Home | Translations | About Us | Privacy | Contact Us