Climate Science Glossary

Term Lookup

Enter a term in the search box to find its definition.

Settings

Use the controls in the far right panel to increase or decrease the number of terms automatically displayed (or to completely turn that feature off).

Term Lookup

Settings


All IPCC definitions taken from Climate Change 2007: The Physical Science Basis. Working Group I Contribution to the Fourth Assessment Report of the Intergovernmental Panel on Climate Change, Annex I, Glossary, pp. 941-954. Cambridge University Press.

Home Arguments Software Resources Comments The Consensus Project Translations About Support

Bluesky Facebook LinkedIn Mastodon MeWe

Twitter YouTube RSS Posts RSS Comments Email Subscribe


Climate's changed before
It's the sun
It's not bad
There is no consensus
It's cooling
Models are unreliable
Temp record is unreliable
Animals and plants can adapt
It hasn't warmed since 1998
Antarctica is gaining ice
View All Arguments...


Username
Password
New? Register here
Forgot your password?

Latest Posts

Archives

Preference for Mild Curry

Posted on 28 February 2011 by dana1981

In a recent post on her blog, climate scientist Judith Curry made some rather extreme comments regarding the IPCC and "hiding the decline" (emphasis added):

“There is no question that the diagrams and accompanying text in the IPCC TAR, AR4 and WMO 1999 are misleading.  I was misled.  Upon considering the material presented in these reports, it did not occur to me that recent paleo data was not consistent with the historical record....It is obvious that there has been deletion of adverse data in figures shown IPCC AR3 and AR4, and the 1999 WMO document.  Not only is this misleading, but it is dishonest (I agree with Muller on this one).  The authors defend themselves by stating that there has been no attempt to hide the divergence problem in the literature, and that the relevant paper was referenced.  I infer then that there is something in the IPCC process or the authors’ interpretation of the IPCC process  (i.e. don’t dilute the message) that corrupted the scientists into deleting the adverse data in these diagrams."

The "divergence problem", as previously discussed by John, refers to the fact that some high latitude tree rings seem to indicate that temperatures have decreased since about 1960, when of course we know temperatures have in reality increased rapidly over that period.  Curry's comments relate to a few graphs which have cut off the tree ring data around 1960, and included data from the instrumental temperature record, which we know accurately reflects global temperatures.

The World Meteorological Organization (WMO) document in question was an obscure report, for which a figure was provided for its cover depicting both instrumental temperature data and reconstructed temperatures based on tree rings.  Criticisms of this figure are valid, as the methods used to create it are not discussed in the report.  However, as noted above, the report was rather obscure, so here we will focus on Curry's criticism of the much more prominent IPCC Third Assessment and Fourth Assessment Reports (TAR and AR4).

IPCC TAR

The controversy in question surrounds the presentation of Keith Briffa's tree ring data.  The only millennial temperature reconstruction presented in the IPCC TAR Summary for Policymakers was the Mann et al. "hockey stick", so Curry's criticisms can only apply to Chapter 2 of Working Group 1 (WG1), which presented reconstructions from Mann et al. (1999), Jones et al. (1998), and Briffa (2000) in Figure 2.21:
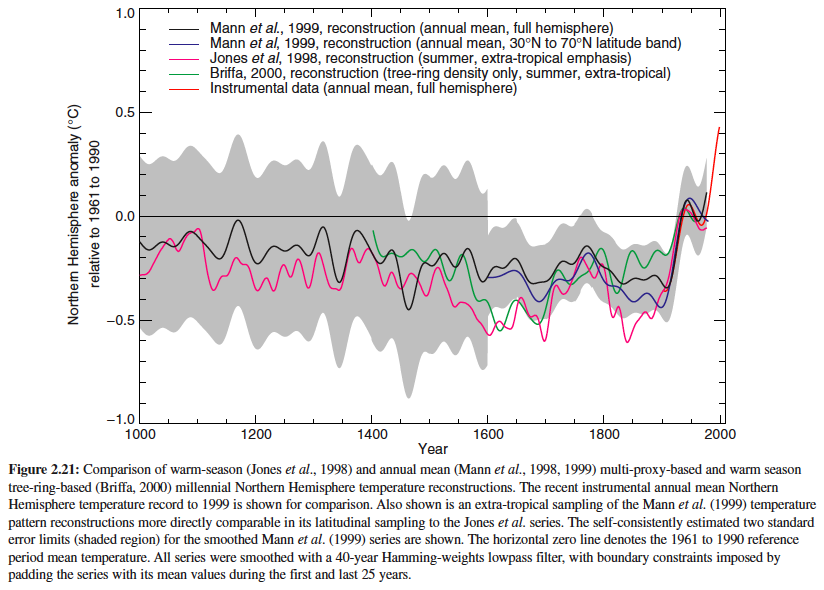
 

It's true that Briffa (2000) included data up to the year 2000, whereas the study's tree ring data presented in this figure is truncated at the year 1960.  And it's true that this fact is not specifically noted in the text or the figure caption.  However, note that the full instrumental temperature record is included (it's not simply spliced to the end of the proxy data), as is specifically mentioned in the caption.  Thus the only potentially valid remaining criticism of the IPCC TAR regarding "hide the decline" is the truncation of Briffa's tree ring data.  Returning to Curry's accusations:

"I was misled.  Upon considering the material presented in these reports, it did not occur to me that recent paleo data was not consistent with the historical record"

Tree Ring Discussion

Section 2.3.2.1 of the IPCC TAR WG1 (Paleoclimate proxy indicators) has a sub-section devoted to a detailed discussion of tree ring data, including the following text (Page 131), emphasis added:

There is evidence, for example, that high latitude tree-ring density variations have changed in their response to temperature in recent decades, associated with possible nonclimatic factors (Briffa et al., 1998a). By contrast, Vaganov et al. (1999) have presented evidence that such changes may actually be climatic and result from the effects of increasing winter precipitation on the starting date of the growing season (see Section 2.7.2.2). Carbon dioxide fertilization may also have an influence, particularly on high-elevation drought-sensitive tree species, although attempts have been made to correct for this effect where appropriate (Mann et al., 1999). Thus climate reconstructions based entirely on tree-ring data are susceptible to several sources of contamination or non-stationarity of response. For these reasons, investigators have increasingly found tree-ring data most useful when supplemented by other types of proxy information in “multi-proxy” estimates of past temperature change (Overpeck et al., 1997; Jones et al., 1998; Mann et al., 1998; 1999; 2000a; 2000b; Crowley and Lowery, 2000).”

This seems like a very clear and explicit discussion of the shortcomings of high latitude tree rings as an accurate temperature proxy over the past several decades, some possible reasons for the divergence, and how the divergence problem should be treated (by supplementing it with other proxies).  Given this detailed discussion, Curry's accusations that with regards to the divergence problem, "there is no question" that the IPCC authors were "misleading", "corrupted", and "dishonest" become very difficult to justify.  Even moreso when we examine the next target of her criticisms: AR4.

IPCC AR4

As with the TAR, the tree ring proxy data and divergence problem discussion in the IPCC AR4 is quite detailed and explicit.  Below is the relevant discussion from AR4 WG1 Section 6.6.1.1 (Page 472-473), emphasis added:

“Several analyses of ring width and ring density chronologies, with otherwise well-established sensitivity to temperature, have shown that they do not emulate the general warming trend evident in instrumental temperature records over recent decades, although they do track the warming that occurred during the early part of the 20th century and they continue to maintain a good correlation with observed temperatures over the full instrumental period at the interannual time scale (Briffa et al., 2004; D’Arrigo, 2006). This ‘divergence’ is apparently restricted to some northern, high latitude regions, but it is certainly not ubiquitous even there. In their large-scale reconstructions based on tree ring density data, Briffa et al. (2001) specifically excluded the post-1960 data in their calibration against instrumental records, to avoid biasing the estimation of the earlier reconstructions (hence they are not shown in Figure 6.10), implicitly assuming that the ‘divergence’ was a uniquely recent phenomenon, as has also been argued by Cook et al. (2004a). Others, however, argue for a breakdown in the assumed linear tree growth response to continued warming, invoking a possible threshold exceedance beyond which moisture stress now limits further growth (D’Arrigo et al., 2004). If true, this would imply a similar limit on the potential to reconstruct possible warm periods in earlier times at such sites. At this time there is no consensus on these issues (for further references see NRC, 2006) and the possibility of investigating them further is restricted by the lack of recent tree ring data at most of the sites from which tree ring data discussed in this chapter were acquired.”

Again, there is a very explicit discussion of the divergence problem (even moreso than in the TAR), of its possible causes, and how it should be dealt with scientifically.  In this case, the text specifically states that the post-1960 data is excluded from the Briffa et al. (2001) data plotted in Figure 6.10:
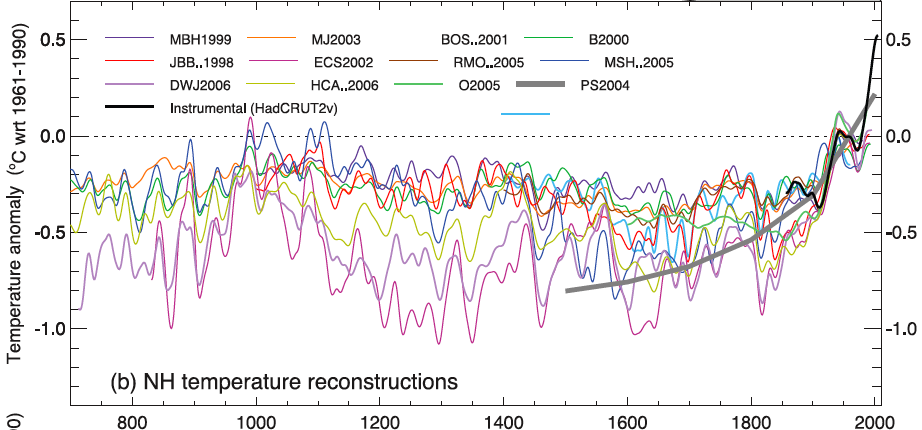
 

Curry's criticisms of IPCC AR4 don't seem the least bit warranted.  The tree ring data and divergence problem are discussed in detail, and the data which is excluded from the relevant figure is specifically mentioned.

When we examine these reports, Curry's criticisms really seem to boil down to the fact that IPCC TAR Figure 2.21 truncated the data from Briffa (2000) without explicitly stating so.  Is this sufficient to warrant Curry's accusations that the IPCC authors were "misleading", "corrupted", and "dishonest"?

Figures as Visual Aids

Climate scientist Gavin Schmidt weighed in with his opinion on this question in Curry's blog post comments:

"Accusations of dishonesty are way beyond a difference of opinion on how a graph should be displayed...Summary graphs are by their very nature, summaries. The graphs you pick out were summaries of various estimates of what paleo-temperature estimates from the literature were. It is therefore not surprising that they show only the reconstructions where the authors had confidence that the reconstructions were actually of the temperatures. 

Problems with modern divergence – which only applies to the Briffa et al curve in any case – are issues to be dealt with in the technical literature, as they still are."

This seems like a fair assessment.  IPCC TAR Figure 2.21 was intended to summarize temperatures over the past millennium as accurately as possible. Briffa and his collaborators felt that their tree ring data did not accurately represent temperatures after 1960, so they truncated it and only provided data up to 1960 to the IPCC.  Perhaps the IPCC report should have explicitly stated that Figure 2.21 excluded the post-1960 tree ring data, but the associated Chapter did contain a discussion of the shortcomings of northern latitude tree ring density measurements over the past few decades.  Perhaps they should have included Briffa's full data set, but that's a subjective decision, and obviously the authors were not confident that the truncated data accurately reflected temperatures, and for good reason.

Curry's extreme accusations regarding the IPCC TAR author's motives certainly don't seem justified in light of the evidence discussed here, and even less so in AR4, which was very clear in discussing the divergence problem. 

The TAR authors' subjective decision to truncate the tree ring data in Figure 2.21 can certainly be debated, but when the discussion turns away from the science and toward inferences about the authors' motives, a civil and intelligent discourse becomes almost impossible.  We join Bart Verheggen's previous calls for Judith Curry to resume attempting to build bridges between the two sides of the climate 'debate' rather than burning them, by toning down the unnecessary and unwarranted accusatory rhetoric.  It's certainly possible to discuss other scientists' subjective decisions without resorting to accusations about their honesty and motives, and doing so will lead to a less inflamed and more constructive discussion.

0 0

Printable Version  |  Link to this page

Comments

Comments 1 to 40:

  1. Remember Dana, Curry is just the "conduit" for disinformation, not the "originator" :P
    0 0
  2. Also, she doesn't claim to be expert on these subjects, she just knows everyone else is wrong.
    0 0
  3. This whole episode is putting me off Curry. Sad really, because I so used to love curry.
    0 0
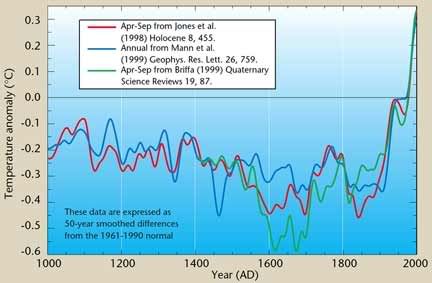
  4. The proxies are inaccurate and do not respond solely on temperature, so there is no reason to hide any data. That is *not* scientific practise deleting adverse data. And for the same reason no thermometer readings are justified being plot on the same graph as I stated on several other topics elsewhere here. A graph from prof Müllers presentation: illustrates clearly, that there are similar "divergence" problems everywhere in the reconstruction. You can watch the hidethedecline part of his talk here. And the main point is, why that is misleading (even if its mentioned in the text) is that, most of the people who read it have no understanding on statistic techniques or the major uncertainities on such statistical excercises. Unless you will use a caption: "Warning. This data is baked to show us the result we wanted. It is purely an artifact of statistical excercises and only the temperatures which have been replaced with thermometers are somewhat reliable." I do not understand how people can still be defending the indefensible like "hide the decline". And Robert Way, please! That is ... . For the 2nd time in a short period of time I see you attacking Curry personally. Last time you used a link on ClimateProgress which is known to be propably the biggest disinformation & ad-hominem site on the whole field. You should be aware that neither you nor Joe Romm have absolutely none of the scientific credentials nor match the expert judgment in the subject. Nope.
    0 0
  5. oops. Someone fix my link, please. Thank you.
    0 0
  6. protestant: The proxies are inaccurate and do not respond solely on temperature, so there is no reason to hide any data. That is *not* scientific practise deleting adverse data. Why would anyone use data they know to be incorrect?
    0 0
  7. Protestant, Curry has very clearly demonstrated that she does not have credentials to speak to paleo data, nor does she have the credentials to speak to climate sensitivity, she things the 90% confidence interval for climate sensitivity lies between 0 to 10 C for goodness' sakes. She is an embarrassment to the scientific community. The divergence problem, IIRC, refers to only one particular dendro chronology, not all dendro chronologies. Protestant, while you are vehemently objecting to plotting thermometer and paleo data on the same graph, please be sure to also tell Ljungqvist and McShane and Wyner that they should have not included the thermometer data on their reconstructions. I'l let someone else address Muller's intriguing talk. And can I take this opportunity to remind everyone that is is now 2011, and not 1999. And I find your comments about CP laughable, you clearly have never read CA or WUWT, now those are in reality probably "the biggest disinformation &ad-hominem site[s] on the whole field"
    0 0
  8. I don't understand what Curry is up to. She claims to be trying to build bridges but it's difficult to work out where those bridges are going from and to : she seems to be constantly accusing certain scientists (and the IPCC as a whole) of dishonesty, etc. and doesn't appear to want to build bridges in that direction; but is constantly appearing on CA and WUWT (and allowing all sorts of accusations and various forms of wild denial on her own website), playing to the crowd. It seems to me that she is trying to build bridges between the so-called skeptical blog scientists and the minority of the general public who spend any time reading blogs, and who might be persuaded to become sceptical because they don't really know who to believe. All very strange.
    0 0
  9. No Evidence of Wrong-Doing by NOAA Climate Scientists - This OIG report came out on the 18th (link to full report in article). Basically, another CRU hack investigation concludes that scientists are clear of any wrongdoing. - Curry's post is dated the 22nd. Talking about "hide the decline", accusing scientists of dishonesty.
    0 0
  10. "The World Meteorological Organization (WMO) document in question was an obscure report, for which a figure was provided for its cover depicting both instrumental temperature data and reconstructed temperatures based on tree rings. Criticisms of this figure are valid, as the methods used to create it are not discussed in the report. " On the contrary, the WMO figure had the caption: "Front cover: Northern Hemisphere temperatures were reconstructed for the past 1000 years (up to 1999) using palaeoclimatic records (tree rings, corals, ice cores, lake sediments, etc.), along with historical and long instrumental records. The data are shown as 50-year smoothed differences from the 1961–1990 normal. Uncertainties are greater in the early part of the millennium (see page 4 for further information). For more details, readers are referred to the PAGES newsletter (Vol. 7, No. 1: March 1999, also available at http://www.pages.unibe.ch) and the National Geophysical Data Center (http://www.ngdc.noaa.gov). (Sources of data: P.D. Jones, K.R. Briffa and T.J. Osborn, University of East Anglia, UK; M.E. Mann, University of Virginia, USA; R.S. Bradley, University of Massachusetts, USA; M.K. Hughes, University of Arizona, USA; and the Hadley Centre, The Met. Office)." The use of instrumental information is explicitly mentioned. Further, as three reconstructions are listed, and only three plots are present on the graph, by logical inference instrumental data must have been used on those plots. Following up to PAGES takes you to an article by Briffa in which he discusses the divergence problem: Briffa, K.R., 1999 “Analysis of dendrochronological variability and associated natural climates - the last 10000 years (ADVANCE-10K).” PAGES Newsletter 7 (No. 1), March 1999, 6-8 (R) Following up to NOAA takes you to original data A case can be argued that Jones should have plotted the reconstructions and the surface station data seperately. But that is just an issue of best presentation, not of deception. Any suggestion that Jones' was dishonest in preparing the WMO graph when he explicitly mentions the inclusion of instrumental data, refers you to a discussion of the divergence problem, and refers you to the original data, is absurd.
    0 0
  11. Protestant, the fact that anyone can call the graph in question dishonest or misleading because: "most of the people who read it have no understanding on statistic techniques or the major uncertainities on such statistical excercises" is a mind bender. Its a technical publication. The people to whom you refer feel comfortable passing judgment on technical literature they don't understand. They are perfectly at home making despicable statements about the character of the scientists involved based on statistical methods that they don't have a clue about. The explanation in the text could not be more clear. If the person reading it is unable to process the explanation they should assume they can't understand the data on the graph, and should get someone that does understand it to explain it, before they draw conclusions that they are, by your own evaluation, unqualified to draw. There is absolutely nothing wrong with the way the information is presented except for the fact that the people judging it are unqualified to do so. Thank you for pointing that out.
    0 0
  12. Protestant, First of all I was using Gavin Schmidt's evaluation of her not my own. And yes Gavin Schmidt is far more qualified than she is on the subject. Secondly, Dr.Joseph Romm's word I would trust before Dr. Curry's on the subject of climate science. Thirdly, where do you come off attacking my academic qualifications in paleoclimate? I'm just curious how you seem to be so aware of my background or what groups I work with. Finally, the biggest misinformation/ad hominem place in the field is steven goddard's site without a doubt, 2nd is WUWT do you need for me to go and fetch you tangible evidence?
    0 0
  13. Protestant, having watched Prof Müller's presentation, I would certainly take any paper by him with a large grain of salt, for he is prepared to lie, and lie repeatedly to make political points: Case in point, he claims that scientists would say they have "seen the data" because they have seen a graph with a stated 50 year smoothing. - Nonsense, no scientist is unaware that the plot of a 50 year smooth will not follow the actual data points. In fact, no moderately competent layperson would be so mistaken. Further case in point - he says "they" smoothed the graph so that the transition from paleo to instrumental data would not be evident. - Nonsense, smoothing is routinely done in all branches of science to show overall trends over particular time scales. In this case, smoothing highlights the real differences between the reconstructions by making it obvious on the graph. Further case in pont - with respect to the WMO graph (the only one he refers to, and the most obscure) he keeps on referring to "they" did this, and "they" did that. - Again, nonsense, Jones and Jones alone prepared the WMO report. Müller is obviously trying to conceal this fact so he can tarnish the whole group of scientists. Further case in point - He says the data was not made available. As noted above, the caption of the graph referred readers to a repository of the data accessible on the Internet. The data for Jones et al (1998), for example, was last updated at that site in December 1998, and has presumably been available since then. Mann et al 1999 has files last modified in March 1999, and hence available since then, although the parent directory was last modified in 2003. Briffra 1998 was last modified in 2003, and Briffra et al (2001) last modifed in 2002, are also now available and there is no reason to think they were not available at the time. In fact, what he has done is assumed the genuine difficulties in obtaining the source data for the HadCRU temperature series applied to all attempts to get original data, which is simply false. Case in point - he claims to be able to show "the original data" that was concealed, but does not show the HadCRU temperature series, but rather the graphs of Mann et al 1999, Jones et al 1998 and Briffa et al 1999, all of which were originally published as graphs in the original publications. In those graphs, he even distorts the data himself. He extends the data to 2000, when it only goes to 1991 and He shows a decline more than double that in the original data. Here is the original data as plotted in Briffa et al 1999 without any hiding of the decline, or truncation of data, for comparison with Müller's as shown by you.: (Briffa et al's data is shown in green.) Given the nature of his talk, this deception show breath taking hypocrisy.
    0 0
  14. Judith Curry has recently asserted: That there is a 33% probability that that actual sensitivity could be higher or lower than my bounds. To bound at a 90% level, I would say the bounds need to be 0-10C. Her previous bounds were 1-6 degrees C. This means that she is saying that climate sensitivity could be greater than 10 degrees five percent of the time and greater than 6 degrees in 16.7% of possible cases. This would make her more alarmist than anybody I know. As a commenter on her blog remarked: 0-10C at 90%? I’d say that makes you more of an alarmist than anyone I’ve ever read. Hansen is Pollyanna in comparison. That looks like a 50% chance of the end of civilization. At the other end of her range she seems to accept the possibility that negative sensitivities are possible. Her range of uncertainty possible outcomes spans everything from the most, er, skeptical to the extreme alarmist; surely, a bridge too far. Perhaps that was just an off-the-cuff comment and we shouldn't take it too seriously. It was, however, made by a climate scientist on a popular blog aimed at the general public. In contrast, the "hide the decline" comment was made years ago in private between scientists who knew how to interpret such a remark, yet we still have Climate Etc devoting entire blog posts to this phrase, as if it were consequential.
    0 0
  15. Ms Curry is apparently a key member of a new group of prominent US physicists reassessing climate change from the ground up to "end the the war". http://www.guardian.co.uk/science/2011/feb/27/can-these-scientists-end-climate-change-war?CMP=twt_gu
    0 0
  16. Stephen Leahy @15, a team headed by Richard Müller (see 13 above) and with Judith Curry as the only climatologist, in a research project partially funded by the Koch brothers? I can hardly wait.
    0 0
  17. Andy S, so Judith Curry is publicly on record as asserting that there is a 5% chance that changes in forcing have effectively zero effect on global temperatures? Anyone who can think that there is at least a 5% chance that the changes between glacials and interglacials is entirely brought about by internal cyclical changes in the environment (as this entails) is massively disconnected from reality.
    0 0
  18. What I find most confusing is that people are going back in time to make these accusations. When these reports came out, no one was attempting anything nefarious, the results weren't THAT controversial, a few liberties in the artwork (explained in the text) not only weren't out of line, but they were helpful in communicating the main message that we were in trouble. Have any of you skeptics ever given a presentation to your peers, and also to the general public? How does that differ from the work you do by yourself? I find I ALWAYS have to simplify, even for my peers, unless we have a weekend workshop or an entire semester to dive into the minutia. And my subject matter is plumbing! If anyone had dreamed of the level of scrutiny - of course they would have been at pains to point out that one of the 13 squiggly lines was truncated (or left it in there). This is, in essence, a rewrite of history to paint these professionals as bad guys. The only trouble is there are millions/billions of us who were alive when the history happened, and we simply are not letting the revisionists get away with it.
    0 0
  19. 16 Tom Curtis So if they find that all the other temp records are essentially the same as their result then we should scrap the lot? Not even prepared to give this a chance?
    0 0
  20. HR @19, actually, I expect them after considerable expense to end up confirming current estimates. I then expect the entire project to be dropped quietly before publication, because I don't trust the principal's bona fides. Of course, they may show some integrity and publish. Of course, given that they have no-one in the team experienced in temperature reconstructions, they may accidentally or deliberately not adjust for surface station distribution, or treat long records from nearby stations as blendable without adjustment as denialists are wont to do. As the team leader has already been caught out in data manipulation (while trying to slander Jones, Mann and Briffa on a charge of data manipulation), I would be foolish to assume this will be an honest, and competent endeavour until they prove otherwise.
    0 0
  21. Tom @17 What she said was that at a 90% level, the bounds are 0-10 degrees. This implies that 10% of the time the sensitivity would be outside that range. If she doesn't accept that sensitivities can be less than zero, then that would mean that there's a 10% chance of it being over 10 degrees. But you should read the the thread I linked to for yourself. I would guess that what she meant was that she doesn't know (or won't say) what the sensitivity range is, so she threw up a big range and said that was the 90% certainty range for good measure. Of course, recognizing more uncertainty does not mean less action is required, on the contrary, more uncertainty means that exceptional outcomes are relatively more likely than in a more tightly bounded probability distribution. It's a pity that we have to guess what she means.
    0 0
  22. actually thoughtfull @18, I was recently looking at the TAR graph in which, according to McIntyre, Mann as lead author placed the Briffa plot underneath the others to hide the end point. That is in fact false, but the difference on the GIF version is just two pixels, and is not visible to the naked eye even at 3 or 4 times magnification. On that difference, McIntyre wants to assassinate Mann's reputation.
    0 0
  23. @Stephen #15, Muller, Curry & co. set out to "make peace" and start by accusing the majority party of dishonesty and malfeasance! I don't think any Peace Prizes will be handed out for their activities
    0 0
  24. I would like someone to ask Curry about that 90%/0-10C sensitivity statement, in an arena where she can't dodge the question. Specifically: What is it based on? What is her assessment of how that remaining 10% of probability is distributed -- is any of it below 0? Is it all above 10C? Unless she has an excellent source for this claim, which seems highly unlikely, given how quickly it would have come to light or even be widely known beforehand, how does she view the professional ethics of a climate scientist making such a statement in public? And how would she react if, say, Mann or Schmidt or Trenberth or Hansen did something similar?
    0 0
  25. Lou #24 - I got the distinct impression that Curry's comments with regards to climate sensitivity were no more than her "gut feeling". She provided no support for the statement, and as others have noted, it's a scientifically and statistically indefensible position. It seems to me that a lot of the things Curry writes on her blog, including with regards to 'hide the decline', are based on little more than her 'gut feeling'. It only took me about a half hour of looking through the TAR and AR4 to see that her accusations had almost no merit.
    0 0
  26. I would like someone to ask Curry about that 90%/0-10C sensitivity statement, in an arena where she can't dodge the question
    We need to hang on to this, and to trot it out whenever she's quoted as believing we should do nothing. 10C globally implies what? 15C over North America and Eurasia? 20C in the Arctic?
    0 0
  27. @16 Tom, I fear the entire Berkeley effort, even if well-intentioned, will be used as another excuse to delay action until we resolve 'the uncertainty'. Hence funding from Koch who are all about deny & delay.
    0 0
  28. Curry is going to be reviled 20 years from now as the scientist who abandoned her profession, her beliefs, and her integrity in order to become a professional concern troll for denialism. Variations on this story line wait for Watts, Inhofe, Monckton, and any number of others. It's going to make for fun reading, and they all have it in their destiny. They can lie and distort all they want now, but the truth, when it arrives, will be "undeniable." End of story. When we reach a point where the public begins to panic, because in spite of all of their clever arguments, temperatures continue to unequivocally rise and extreme events become more and more common and alarming, then I expect Curry to try to salvage her reputation in the eyes of history (along with any number of other high profile deniers) by back pedaling, insisting that she was just being open minded, and that she really was trying to build bridges, and that she's sadly misunderstood and being unfairly victimized. I'd love to be at a major climate science meeting come that time, and to hear the intense silence that falls when she enters the room.
    0 0
  29. Sphaerica.... I have to say, I think you are exactly right. I get the sense that Curry is just not quite clear on what she's gotten herself into. It's a little like she's gone into the den of the lion saying, "Aw, you just have to make friends with the poor beast." Her whole current series of posts on "Hide the decline" is a perfect example. Given the broad spectrum of research on climate change, I can't think of a more NON-issue than that. I also can't think of one other issue that climate deniers more quickly glob onto (execpt maybe Al Gore). But there she spent the better part of a week hashing that out on her blog to the chorus of a couple thousand comments. You'll have to pardon my non-scientist perspective here but Peter Hadfield has a really great, simple video titled The Scientific Method Made Easy where he points out that, it doesn't matter if someone gets it wrong, bad science will always be supplanted by better science. (I realize that's probably overly idealized, but for the sake of argument...) So, even if Mann and others had completely cooked the data, ultimately it wouldn't even matter. If they are wrong their work will disappear into obscurity. And it's not like this is the cornerstone of the entire TAR and AR4. It's one piece of information out of thousands upon thousands. So, here Curry is hammering away on how "she" was deceived blah, blah, blah. I just want to tell her to get over it. Either publish a real response to the work or do some better science of your own. The only thing she accomplishes building this "bridge" to the deniers is to fuel the fire they've built and isolate herself from the scientific community. As far as I can see, she's done nothing at all to improve the situation, in fact I think she's made it worse. And I think you're right, a decade or so down the road she is going to very much regret having made the decisions she has.
    0 0
  30. @ Tom Curtis #20. I heartily agree. Remember that the people who hacked the CRU computers got their hands on *all* the raw temperature data that East Anglia University had at their disposal, which means so did the Climate Change Deniers whose websites hosted the hacked material. Yet more than a year after "Climate-gate", have they chosen to publish their own versions of the climate data? No. Probably because, after painstaking analysis, they were left with the fact that the data was completely accurate-not that they would tell the public that. Instead they chose to release a bunch of e-mails-out of context-to paint the CRU guys in the worst light possible.
    0 0
  31. Rob #29 -
    "even if Mann and others had completely cooked the data, ultimately it wouldn't even matter. If they are wrong their work will disappear into obscurity."
    In fact we saw this was the case with the IPCC. Even if there are valid criticisms of the way the TAR handled the tree ring data, the IPCC was even more thorough and explicit about it in AR4. Of course, that didn't stop Curry from lumping both reports together in her extreme accusations, but it proves your point that flawed science gets supplanted. Same thing for the "hockey stick". It was a good first effort, but imperfect. Now millennial temp reconstructions all show a bit more natural variability over the past 2,000 years. The "skeptics" continue to obsess over the 11-year-old reconstruction, but it's been supplanted with even better scientific work. Including by Mann himself! I agree it's unfortunate that Curry seems to be mired over a decade in the past on a very minor issue. It's not worth wasting time over.
    0 0
  32. Andy S @ 21: "It's a pity that we have to guess what she means." I don't think we have to guess at all. On the thread where she makes the assessment, first she responds to Zeke's statement of "likely" (>66%) climate sensitity by saying: I think we can bound this between 1 and 6C at a likely level, I don’t think we can justify narrowing this further. Asked to clarify what she means, she says: That there is a 33% probability that that actual sensitivity could be higher or lower than my bounds. To bound at a 90% level, I would say the bounds need to be 0-10C. (My highlights.) She's not talking about whether the quality of the data allows you to make such-and-such a bounded estimate, or the accuracy of the measuring devices or anything like that. She is clearly saying that there is a 33% chance that the ACTUAL climate sensitivity is outside of the range of 1-6C, and a 10% that it is outside of 0-10C. I mention this only because an apologist tries to dodge this on the next thread, by talking about confidence intervals - which with enough convoluting you might be able to shy away from this. But that's NOT what Curry is saying. She is outright declaring that the PROBABILITY is that the actual sensitivities are outside those bounds. Now, yes, we don't know how she is assigning that probability to the low and high ends. But we're not guessing that this is exactly what she said. Whether she meant to say this is another matter... I suspect she'll walk back from this in some way, but if so I think we should again press for a clear articulation of what she means...
    0 0
  33. rustneversleeps @ 32... I get the distinct sense that she was firing from the hip with that statement. I don't think it's based on anything other than she wants to play both sides somehow. She wants to appease the denier crowd by saying climate sensitivity could be in the range of zero (which seems insane being that we don't have a perfectly stable climate over long periods), and she wants to appease the pro-AGW crowd to suggest that sensitivity could be a terrifying 10C. If she's building a bridge here it's not made with anything of substance as far as I can see.
    0 0
  34. I spend a fair time on education discussions. It just occurred to me that Curry looks an awful lot like those naive teachers and administrators who go into those out of control classrooms or schools. They have the apparently laudable objective of getting "on-side" with the trouble-makers who won't learn anything themselves and spend all their efforts on disrupting the learning of others. And where does this get these misguided teachers? The troublemakers learn that bad behaviour gets not only no penalty, but real benefits. So more students behave more badly because they see no point in hard work or good behaviour - and they too get kind words and a fizzy drink as consequence of deliberately disruptive behaviour. Sound familiar to anyone else?
    0 0
  35. doghza @26, 10 degrees climate sensitivity means about 11 degrees temperature increase by 2100, with another 4 in the pipeline on Business as Usual. With that high a climate sensitivity, I think the real risk we are facing is not massive economic disruption and human hardship following drought, but of a Venus style runaway greenhouse. Of course, I'm not the one saying there is a 5% chance climate sensitivity is that high, or higher.
    0 0
  36. Rob @ 33, No doubt it was shoot-from-the-hip and unsupported, but I think the intent was primarily delay - by both playing up the big bad uncertainty boogie monster, and to argue that (extremely) low sensitivity is plausible enough to give us pause on action. In caually tossing out these bounds and probabilities - likely with little thought - she inadvertently wandered into cloud cuckooland at both ends. I don't think there was any subtle strategy aforethought, let alone a bridge-building one.
    0 0
  37. rustneversleeps @32, I think you are right in your analysis of what Curry said, and why she said it. I would add, however, that she is probably aware that studies of climate sensitivity show far higher resolution of low values than of high values. That is evident in the change in her low and high end ranges for the 66% and 90% confidence intervals. Consequently her statement implies that she believes there is a substantive (at least 1%) risk that sensitivity is significantly higher than 10. However, I suspect her first back down would be to insist she was talking in round figures. That being the case, we should interpret her confidence intervals as: 1.49 to 5.5 for 66% confidence and 0.49 to 9.5 for 90% confidence Still very scary from a decision theory point of view, and pretty indefensible scientifically.
    0 0
  38. adelady @34, one of the most insightful comments I have seen.
    0 0
  39. doghza @26, 10 degrees climate sensitivity means about 11 degrees temperature increase by 2100, with another 4 in the pipeline on Business as Usual. With that high a climate sensitivity, I think the real risk we are facing is not massive economic disruption and human hardship following drought, but of a Venus style runaway greenhouse.
    Well, let's not split hairs. Curry apparently believes there's a good chance we're totally screwed, or (if you're right) totally fucked. Take your pick :)
    0 0
  40. Rust@36 I agree but it is odd that such wild and poorly thought-out uncertainty estimates--and of a critical parameter to boot--are made by the very climate scientist whose main criticism of the IPCC and others is that they address uncertainty inadequately.
    0 0

You need to be logged in to post a comment. Login via the left margin or if you're new, register here.


The Consensus Project Website

THE ESCALATOR

(free to republish)


© Copyright 2024 John Cook
Home | Translations | About Us | Privacy | Contact Us