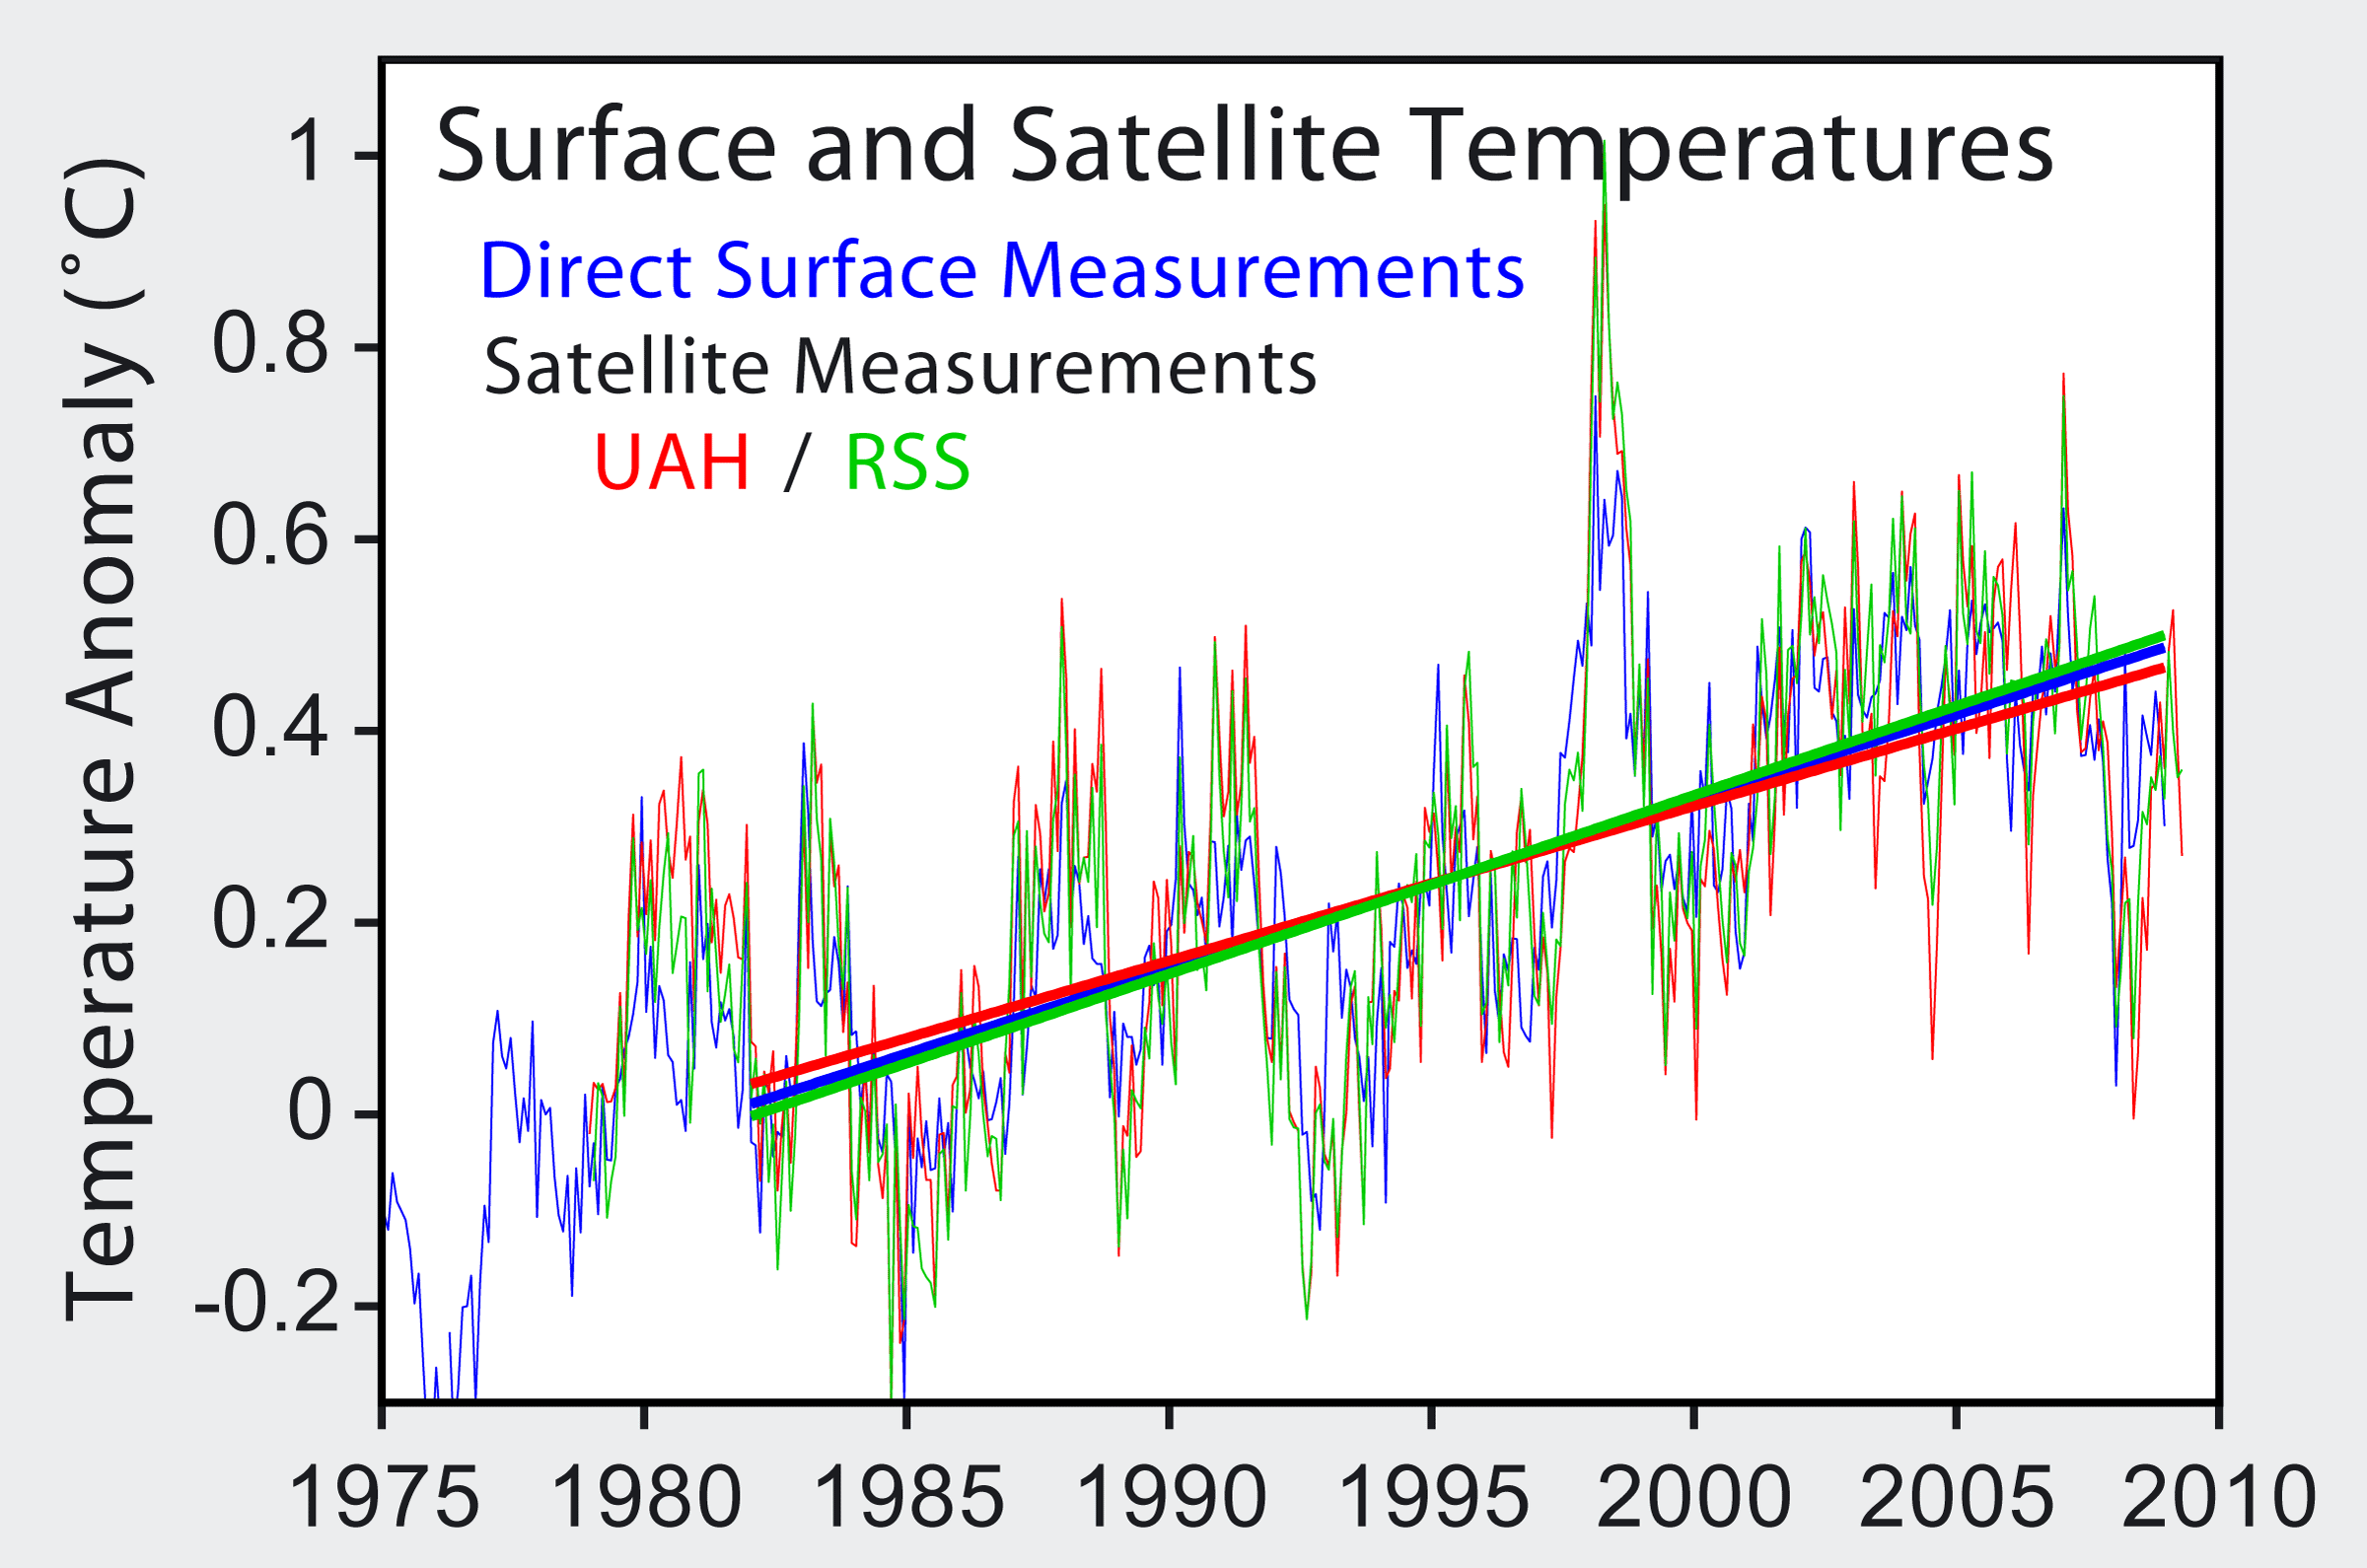
Satellite measurements of warming in the troposphere
What the science says...
| Select a level... |
 Basic
Basic
|
 Intermediate
|
 Advanced
| ||||
|
The most recent satellite data show that the earth as a whole is warming. |
|||||||
Climate Myth...
Satellites show no warming in the troposphere
"Satellite measurements indicate an absence of significant global warming since 1979, the very period that human carbon dioxide emissions have been increasing rapidly. The satellite data signal not only the absence of substantial human-induced warming but also provide an empirical test of the greenhouse hypothesis - a test that the hypothesis fails." (Bob Carter)
John Christy and Roy Spencer of the University of Alabama published a series of papers starting about 1990 that implied the troposphere was warming at a much slower rate than the surface temperature record and climate models indicated Spencer and Christy (1992). One early version of their data even showed a cooling trend (Christy et al. 1995).
Several groups of scientists began looking closely at this discrepancy. With so many other pieces of evidence indicating warming, it seemed unlikely that the troposphere would not be warming. Errors were discovered in the methods the UAH group used to adjust the data.
To understand what was wrong: The satellites must pass over the same spot on Earth at the same time each day to get a temperature average. In reality the time the satellite passes drifts slightly as the orbit slowly decays. To compensate for this and other orbital changes a series of adjustments must be applied to the data.

The MSU satellite data is collected from a number of satellites orbiting & providing daily coverage of some 80% of the Earth's surface. Each day the orbits shift and 100% coverage is achieved every 3-4 days. The microwave sensors on the satellites do not directly measure temperature, but rather radiation given off by oxygen in the Earth's atmosphere. The intensity of this radiation is directly proportional to the temperature of the air and is therefore used to estimate global temperatures.
There are also differences between the sensors that were onboard each satellite and merging this data to one continuous record is not easily done. It was nearly 13 years after the orginal papers that the adjustments that Christy and Spencer originally applied were found to be incorrect. Mears et al. (2003) and Mears et al. (2005).
When the correct adjustments to the data were applied the data matched much more closely the trends expected by climate models. It was also more consistent with the historical record of troposphere temperatures obtained from weather balloons. As better methods to adjust for biases in instruments and orbital changes have been developed, the differences between the surface temperature record and the troposphere have steadily decreased.
At least two other groups keep track of the tropospheric temperature using satellites and they all now show warming in the troposphere that is consistent with the surface temperature record. Furthermore data also shows now that the stratosphere is cooling as predicted by the physics.
All three groups measuring temperatures of the troposphere show a warming trend. The U.S. Climate Change Science Program produced a study (pdf) in April 2006 on this topic. Lead authors included John Christy of UAH and Ben Santer of Lawrence Livermore National Labs. The first page has this quote:
Previously reported discrepancies between the amount of warming near the surface and higher in the atmosphere have been used to challenge the reliability of climate models and the reality of human-induced global warming... This significant discrepancy no longer exists because errors in the satellite and radiosonde data have been identified and corrected. New data sets have also been developed that do not show such discrepancies."
There are still some discrepancies between satellite measured temperatures in the tropics and those measured by radiosondes. Most researchers believe this difference is likely due to instrument errors.
The original discrepancy is an excellent example of how science works and of critical thinking. With many different indicators showing warming, it did not make sense that the troposphere would be cooling. This discrepancy was taken very seriously by the scientific community, and the consistency and accuracy of all relevant data were examined intensely.
Science advances by trial and error. The result is an increased knowledge of how to measure the temperature of the troposphere from space.
Last updated on 24 July 2015 by David Kirtley. View Archives


 Arguments


[DB] Please, no All-Caps.
[JH]CCSP = US Climate Change Science Program.Roy Spencer's latest claim that the tropospheric temperature proves the models wrong, has been aptly shot full of holes by Glenn Tamblyn and others. For example, Spencer compared temperature observations from only the tropics, to model results between 20 and 20 latitudes. Spencer compared model results for the surface, to observations of the "middle troposphere." Spencer's observations of the "middle troposphere" actually are 1/4 from the stratosphere, which of course cools as a consequence of increased greenhouse gases.
The question WHY the trend line was from 1982 to ~2009 intrigues me because it is said that climatology deals in 30 year intervals or more. So 1979 to 2009 would be a "better" line. But it looks like the chart would show nearly the same result.